


Summary
- 6 Sigma and Operational Excellence. Just Common Sense?
- How many values are necessary to have a representative sample?
- Statistical modeling: The need for a reliable approach to improve process knowledge and understanding
- Bayesian approach in cosmetical research : Application to a meta-analysis on the anti-pigmenting effect of vitamin C
- Comparability, equivalence, similarity… How statistics can help us to demonstrate these. And soon, the end of blind testing for health authorities and manufacturers.
- Maintenance of the validated state, a stage in the validation cycle.
For several years now, the pharmaceutical industry, which previously had been very timid because of strict regulatory pressures and little adapted to change management, has had to regularly optimize and modify its manufacturing processes, renovate its production plants, or, in order to improve its flexibility and agility, transfer processes to new production sites.

In fact, driven by technological innovations and by the necessity to improve process performance and control, manufacturers are implementing improvement plans which will de facto have an impact on the validated state of processes and marketing authorization applications, sometimes accompanied by additional clinical studies and therefore by long and complex regulatory procedures.
Health authorities have also become aware of the value of these changes which contribute significantly to the safety and availability of drugs.
It is for this reason that pharmaceutical regulations change regularly with the issuing of guidelines or the updating of GMPs incorporating, amongst other things, the concept of “product lifecycle”, risk assessment and management, “Quality by design”, and continuous process verification.
These include, amongst others:
- ICH Q5E: Note for guidance on biotechnological/biological products subjected to changes in their manufacturing process (CPMP/ICH/5721/03)
- ICH Q8 : Pharmaceutical Development (EMA/CHMP/ICH/167068/2004)
- ICH Q9 : Quality Risk Management (EMA/CHMP/ICH/24235/2006)
- ICH Q10 : Pharmaceutical quality system (EMA/CHMP/ICH/214732/2007)
- ICH Q11 : Development and manufacture of drug substances (chemical entities and biotechnological/biological entities, EMA/CHMP/ICH/425213/2011.
More recently the ICH Q12 guideline: Technical and regulatory considerations for pharmaceutical product lifecycle management, which was in a public consultation process until December 2018, and is to be adopted at the end of 2019, expressed the wish of health authorities to simplify regulatory procedures in order to promote innovation and continuous improvement.
Any process modification made to a commercialized process must be supported by a validation study demonstrating the control and reproducibility of the modified process, and must also be supplemented by a comparability study in order to demonstrate that the quality of the product obtained after the process modification is comparable to that of the product before modification. This comparability will thus help to limit or even avoid the need for clinical studies for post-approval change.
One of the most important elements for demonstrating this comparability is the use of statistics. Yet we still need to know which statistical tools to use and design studies appropriately. Sample size, number of repetitions, risk levels… are all difficult parameters to define for non-statisticians. Increasing numbers of companies now have their own “statistics” department or call on the services of companies which specialize in statistics. But here again, difficulties are often encountered linked to misunderstandings between two different areas of expertise: the process/product experts and the statisticians.
It is not easy for the person commissioning the study to express their requirements clearly. Faced with a vague expression of need, the statistician cannot provide a suitable response without understanding the problem in depth. We then have a statistical analysis which at best leads to uninterpretable results and at worst to an erroneous interpretation such as, for example, the non-comparability of results even though the results are comparable, or the reverse.
This is why genuine collaborative work between the 2 entities and a mutual understanding of needs and constraints are essential. Divergent approaches, lack of understanding, and different language and vocabulary can also be observed amongst the inspectorate and appraisers.
One can easily imagine difficult situations in presenting such studies in an inspection context if neither party possesses a common language or subject expertise. Of course, the impact will be inversely proportional to the level of incomprehension and expertise of the different protagonists.
This is why, in March 2017, the EMA published a draft entitled “Reflection paper on statistical methodology for the comparative assessment of quality attributes in drug development“. This draft was in public consultation for 1 year in order to allow industries to interact with the EMA via the SAWP scientific committee (Scientific Advice Working Party) with regard to content, as well as to allow alternative methods, not presented in this document, to be proposed. At the end of this consultation period, the EMA organized a workshop with manufacturers in May 2018, in order to discuss the content and its implications for the industry.
In 2017, A3P created a “Statistics” CIG in order, in the first instance, to comment on this draft and then to draw up guidelines. At the beginning of 2018, members of the CIG submitted their comments then in May 2018, a representative of the CIG took part in a workshop organized by the EMA on behalf of A3P.
The objective of this article is to summarize the important points of the draft (currently under discussion at the EMA with a final release planned for the end of 2019), and of the comments submitted by A3P, and will end with a conclusion including the follow up statistical work of the CIG.
1. Summary of the draft “Reflection paper on statistical methodology for the comparative assessment of quality attributes in drug development”
The comparison of product quality attributes data is indispensable whether this is during the development stages of a new product or throughout the lifecycle of a marketed drug. The health authorities wish, through this document, to establish a common language and increase understanding amongst the different experts involved in comparative studies of quality attributes.
So, the objective of this document is to present the statistical approaches which allow product quality data to be compared, or in other words product characteristics in the following 3 cases:
- process changes and/or analytical method changes that impact a marketed product,
- comparison of a biosimilar candidate to a reference drug
- comparison of a generic drug with a reference drug
In the context of this article, the summary relates mainly to the first case: process changes that impact a marketed product. In fact, as members of the CIG do have sufficient expertise in the field of biosimilars and generics, we have not taken the liberty of analyzing or commenting on these sections.
The objective of a comparative study is to demonstrate that two products are comparable or that two test profiles can be considered similar.
One of the difficulties encountered when wishing to compare two populations is the definition of acceptance criteria as the size of the sample to be assessed is small. In fact, whether this is during the development phases or in the context of a process change, the number of lots used for the comparability study (validation lots or development lots) is limited. In order to have a representative sample, at least one dozen lots would need to be produced while incorporating the intrinsic variability of the processes (campaign effects, variability of raw materials…). For the manufacturers, the cost and the time required for such a study is impossible to bear, as the lots are on an industrial scale and mostly non-marketable. The health authorities are aware of this and therefore do not require a minimum number of lots as this would hinder innovation, as continuous improvement increases product safety and the drug availability. This is why this document places great emphasis on statistical approaches based on small samples.
1.1. Comparison of data in the context of a change in a commercialized process
The comparison of product quality attributes is very common during modification of a process step, a change of raw material, scale up, or transfers of technology/processes to a new building or a new site…
As specified in the introduction, there is an ICH Q5E guideline for biological products: “note for guidance biotechnological/biological products subjected to changes in their manufacturing process” the objective of which is to provide guidelines and principles which allow the comparability of product quality to be demonstrated in the context of process modifications. This guideline provides an understanding of the value and power of these studies as they will help to demonstrate that product efficacy, purity and safety, through the quality attributes of the product (standard control profile and additional characteristics), are not impacted by the modification. They must be sufficiently powerful to justify not conducting clinical studies.
Sometimes, the modification may have the objective of improving product quality as for example its purity and the comparative study must then be based on an appropriate statistical analysis.
Unlike biosimilars, in the case of modifications of commercialized processes, the acceptability criterion for the reference product can be defined over a large number of samples, as the production history for standard quality attributes can be used. This will provide an understanding of the sources of process variability and the excursion rates. Conversely, the number of post-modifications lots will always be limited. Thus, the difficulty of these studies will revolve around the choice of a suitable statistical tool which will allow a criterion based on a large number of references lots to be compared with data obtained from a small number of lots.
It is important to emphasize that the document firmly states that comparability should be assessed on several characteristics and that the statistical approach should be adapted to each type of characteristic.
1.2 The different statistical approaches and their limitations
1.2-1. Choice of characteristics to be compared and objectives
For each quality attribute selected, the objective is to compare the results of both manufacturing processes.
The statistical approach should be based on the type of data: continuous or discrete.
For continuous data, one of the options is to compare the mean of the distributions which can be supplemented by a comparison of the deviation or the variance of the distributions.
More generally, the comparison of data is mostly based on the following options:
- • Compliance with specification limits
This approach allows a comparison of each characteristic of a lot with a predefined specification which can be one-sided or two-sided. In this case, it is important to check how and when these intervals were defined, to check their relevance to the study objective as well as to ensure that the process in place at the time of the definition of specifications is still representative of the current process which will be used as a reference.
- Non-inferiority comparison
In this case, two series of lots are compared with the objective of demonstrating that one of the two processes does not produce a product of inferior quality to the other measured in accordance with appropriate product characteristics.
In statistics this corresponds to a one-tailed statistical test. One of the classic approaches is to carry out a non-inferiority investigation via a comparison of the data with a one-tailed interval derived from a real sample and with an interval defined a priori.
- Comparison with a two-tailed interval of similarity/equivalence
In this case, we are seeking rather to demonstrate that the product quality of the 2 processes is equivalent, that is to say that the two processes generate products of an equivalent quality.
One of the approaches is to define a two-tailed confidence interval and to compare this interval with a predefined equivalence margin.
This approach implies the hypothesis of reproducible processes.
1.2.2 Understanding the sources of variability of quality data
In this paragraph, the health authorities wished to emphasize the importance of taking account of the fact that comparative studies will be carried out on the basis of product quality data from different lots and that consequently the variability of the process and the analytical methods will be factors in the comparability. It is therefore important prior to a study to fully understand the process and its variability as well as to know the variability of the analytical methods. It is therefore recommended to reduce the assignable sources of variability as far as possible in order to only retain the process’s intrinsic sources of variability.
Different sources of variability have been listed as an example without claiming to be exhaustive:
- Inter-lot variability
- Intra-lot variability
- Intra-sample variability
- Analytical variability
This point is important as the more variable the reference process, the greater will be the spread of the comparability criterion and therefore the pertinence of the study will be reduced. Sample size will also be dependent on overall variability.
1.2-3 Randomization of samples / experimental approach
As has been broached several times already, the data to be analyzed should be representative of the process to be evaluated. The ideal scenario would be to adopt a randomization approach to sampling. But this approach implies that each unit must have the same chance of being selected. In the context of product quality attributes, this approach is not really applicable, since in general the number of post-modification lots is limited, and lots are manufactured consecutively.
In this case, once again, it is important to understand the variability of the process so as to define a representative sampling plan and avoid over-restrictive sampling which does not allow a relevant comparative analysis to be made. If the sampling plan is not representative, then whatever statistical model is implemented, the resulting interpretation will not be robust.
In certain cases, pseudo-randomized sampling can be implemented in order to deliberately choose lots which are representative of certain conditions.
1.2-4 Measurement methods for describing the differences between two processes
Once the parameters of interest have been selected, the next step is to identify the measurement methods for describing the differences between the parameters for the two data distributions. For example, for a comparative analysis of means, the measurement method corresponds to the difference between means or the ratio of means.
The definition of these measurement methods for describing the difference between two unknown data distributions amounts to calculating the difference existing between these two distributions and therefore of simplifying the analysis.
1.2-5. Statistical intervals incorporating the quantification of uncertainties
The calculation of certain statistical intervals can in some cases allow quantification of the uncertainty associated with the fact that a conclusion will be made on the basis of a sample which is applicable to all the lots which will be manufactured with this process.
So as to make maximum use of the properties of the statistical intervals in defining comparability criteria, it is essential that the objective of the comparison and the measurement methods for characterizing the differences are chosen with great care.
1.2-5-1 comparability approaches based on commonly encountered intervals
It should be reiterated that a clear distinction must be made between the quantification of uncertainties using statistical intervals and the definition of comparability criteria.
In practice, the comparability intervals or criteria are frequently based on a statistical interval, as for example: min/max or tolerance interval calculated for a characteristic of the reference product.
- Min/Max Approach
The Min/Max approach describes the spread of the data for a sample but does not take into account the uncertainty associated with the data distribution.
The Min/Max approach is recommended rather for comparing the product quality attributes of two series of lots before and after modification. The analysis will therefore consist in checking that for each product quality attribute selected, the minimum and maximum value obtained for all post-modification lots falls within the Min/Max range defined on a sample representative of the reference process before modification.
This approach has its limitations and is relatively non-discriminatory, as the smaller the number of post-modifications lots the higher are the chances of falling within the Min/Max reference interval and therefore of claiming a false comparability.
- Tolerance interval & x-sigma approaches
A tolerance interval is generally calculated to estimate the spread of data for a proportion (p) of the population covered with a confidence level (c) of x%.
Although the tolerance interval is conceptually appropriate for describing the uncertainty level associated with an unknown data distribution, its use requires particular attention:
– Verification of the normality of the data distribution.
– The choice of values for parameters p and c.
And requires a large number of lots in order to compensate for the limitations of these approaches.
1.2-5-2 principles for calculating the statistical intervals for the comparison of quality attributes
- Prediction intervals
Prediction intervals allow us to describe a predictive interval incorporating data which will be generated in the future. They can be calculated for a single future observation or several (k) observations.
- Confidence intervals
These are most often used for non-inferiority studies during clinical studies.
1.3 Specificities for comparability studies in the context of a process modification
The necessity to have a sample which is representative of the units produced is one of the limiting factors. As, even though it is easy to obtain a sample which is representative of the process before modification, it is difficult to carry out an analysis with a sample which is representative of the process after modification. No minimum number of post-modification lots is required by the authorities. But the number of lots should be defined on the basis of the reproducibility and variability of the process.
Finally, the authorities require the statistical methods and the sample size to be justified while taking account of process variability.
In summary, it can be seen in this document that the subject of comparability studies and associated statistical analyses is still confused given its complexity and the level of expertise required. In fact, in this document there is a lack of differentiation between the statistical analyses to be implemented for biosimilars, for post-approval modifications or transfers of processes/analytical methods and for processes in the development phase. In these 3 cases, the objectives and the conditions are very different and therefore the statistical tools must be appropriate. That is why the general comments summarized in the following paragraph mainly focus on more precise definitions, and a reorganization of the document in order to separate the 3 major themes: biosimilars, post-approval modifications or transfers of processes and methods, and processes in the development phase/clinical studies.
2. Summary of comments from the CIG submitted to the EMA
As the members of the CIG have no experience with biosimilars, this part of the guideline was not commented on. The comments therefore mainly focus on post-approval modifications or transfers of processes and analytical methods.
- Dissociating the 3 main fields: post-approval modifications, biosimilars and development of generics.
- For post-approval modifications:
– Taking account of industrial constraints as it is not possible to have 10 or more post-modification lots to make the comparison
– Taking account of the sources of variability of the process
– Strengthening the study by considering the data which will be generated through continued process verification (CPV)
– Not rejecting the intervals approach (prediction, x-sigma, tolerance interval…)
– Not imposing the applicable equivalence test especially for comparative studies conducted during clinical studies
– Combining weight and sample size in the calculation and the equivalence margin - In order to align manufacturers and authorities, we have requested that the terms similarity, equivalence and comparability are precisely defined. For example, similarity should be reserved for studies on biosimilars and comparability for other products.
- Statisticians not specialized in statistical analyses of clinical studies also contributed to this document in order not to apply a clinical study approach to post-approval comparability studies.
- For comparability studies using the interval approach, sample size (the number of lots available for the study), should be consistent with the study and restricted to comparability studies used in the context of a post-approval change of process or method.
- A section of the guideline should deal with equivalence approaches in the context of changes applied to analytical methods.
- The Bayesian method should be able to be used for small sample sizes and a specific paragraph was recommended to provide details of this method with its limitations and scope.
- In the case of a comparative study involving a small number of lots for post-approval changes and/or if the equivalence approach is not applicable, then the x-sigma approach supplemented by further follow-up should be able to be used. So, step 3 of process validation entitled CPV (Continued Process Verification) should be able to be used to strengthen the demonstration of comparability over the long term.
- For some products such as vaccines or biological products manufactured by campaign, a campaign effect can sometimes be seen resulting from, for example, the variability of raw materials, thus forming an integral part of the common causes of process variability. For this reason, this specific feature should be taken into account in comparability studies and addressed in the document.
- A non-parametric or Min/Max method can be used when there is not sufficient data or if the normality of distribution is not demonstrated.
- We also suggested that statistical analysis should not be the only element supporting comparability. Additional elements such as clinical data should confirm the results of the statistical study and comparability should be determined on the basis of all elements: statistical data, clinical data and process/product expertise.
- Contrary to the document proposing that comparability criteria should be defined solely on the basis of the variability of product quality data, the members of the CIG proposed 2 approaches for defining comparability criteria: either based on scientific knowledge and product & clinical expertise or based on the potential impact on process capability in order to take account of the mean and the variability of the results.
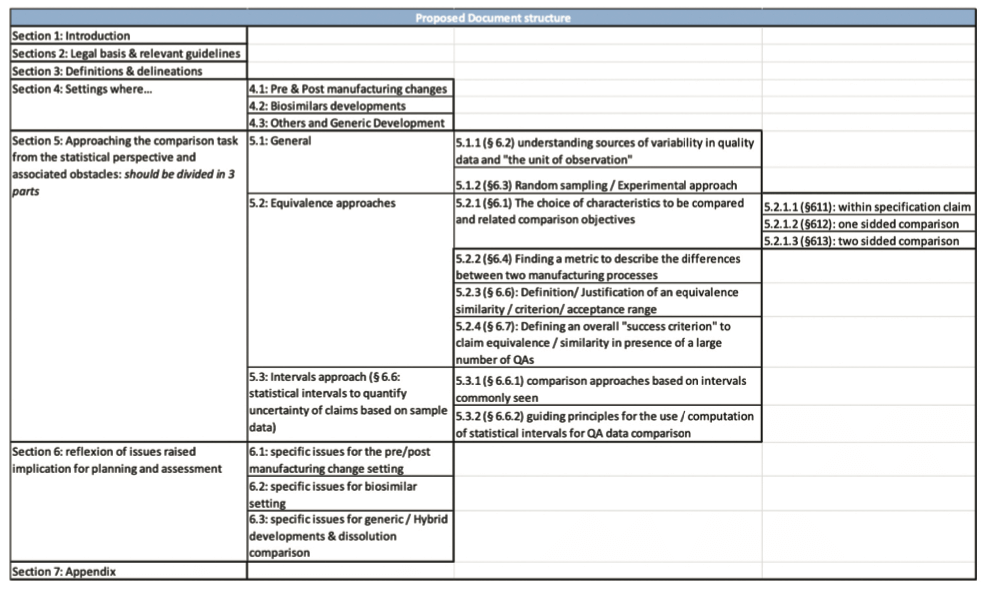
- Finally, we suggested that the document should be rewritten in order to clearly dissociate the different approaches and the 3 major fields: post-approval changes, biosimilars and the development of generics, based on the following structure.
3. Summary of the workshop organized by the EMA in London on 3 and 4 May 2018 following the public consultation period
Around 60 people took part in this workshop, of whom around 30 represented the health authorities and 30 came from the pharmaceutical industry or pharmaceutical industry associations.
5 open sessions with manufacturers, each session including a presentation of case studies by manufacturers or by health authority representatives, with a time for discussion/exchange of information at the end of the session.
- Identification of the situation and the challenges:
– discussion of the necessity and appropriateness of applying the same criteria to biosimilars and post-approval modifications. - Case studies of post-approval modifications:
– Focus on the variability inherent in biological products and processes but the approaches can be shared with those of standard pharmaceutical products.
– The importance of sample size, of lot selection, the appropriateness of the product characteristics to be compared, tolerance interval approaches (prediction intervals, tolerance intervals or Min/Max) were discussed. - Case studies of biosimilars
- Characteristics frequently used to establish criteria of similarity
- New strategies and alternative methods
To conclude the workshop, it was acknowledged that:
- The different approaches and fields should be dissociated and separated in the document.
- The approaches for defining criteria of similarity for biosimilars should be tailored and stricter than in the case of post-approval changes.
- It was difficult to recommend an optimal approach for defining a criterion and a possible alternative might be rather to focus on the common understanding of the importance of having an acceptance criterion in place suitable for the case.
Conclusion
It can be seen through this draft that terminologies and approaches must be specified depending on the field and that new statistical methods must be incorporated.
Nevertheless, it is undeniable that without statistics we cannot carry out robust and relevant comparative studies, but all protagonists must have a good knowledge and understanding of the processes and statistical methods, and needs must be clearly identified.
Finally, as stated in the introduction, this document is perfectly in line with the developments in process validation approaches as well as with the ICH Q12 guideline. The aim is to promote innovation, increase product quality and safeguard drug availability.
During the development phases of a process, the knowledge and understanding of the process/product via “Quality by design” will lay the necessary foundations for future comparability studies. Process validation will demonstrate the reproducibility and intrinsic variability of an industrial process. Any change occurring post-approval must, in addition to validation, demonstrate the product’s comparability and CPV will back up the comparability studies. This overall approach will therefore allow safe and effective products to be placed on the market using controlled, reproducible processes.
 | For this reason, A3P has set up 4 CIGs on these themes.
|
Share Article


A3P STATISTICS CIG
References
ICH Q5E: Note for guidance on biotechnological/biological products subjected to changes in their manufacturing process (CPMP/ICH/5721/03)
ICH Q8: Pharmaceutical Development (EMA/CHMP/ICH/167068/2004)
ICH Q9: Quality Risk Management (EMA/CHMP/ICH/24235/2006)
ICH Q10: Pharmaceutical quality system (EMA/CHMP/ICH/214732/2007)
ICH Q11: Development and manufacture of drug substances (chemical entities and biotechnological/biological entities, EMA/CHMP/ICH/425213/2011.
ICHQ12: Draft: Technical and regulatory considerations for pharmaceutical product lifecycle management,
Glossary
CIG : Common interest group
ICH : International Council for Harmonisation
EMA: European Medecines Agency
GMP : Good Manufacturing Practices
CPV : Continued Process Verification
