


Summary
- 6 Sigma and Operational Excellence. Just Common Sense?
- How many values are necessary to have a representative sample?
- Statistical modeling: The need for a reliable approach to improve process knowledge and understanding
- Bayesian approach in cosmetical research : Application to a meta-analysis on the anti-pigmenting effect of vitamin C
- Comparability, equivalence, similarity… How statistics can help us to demonstrate these. And soon, the end of blind testing for health authorities and manufacturers.
- Maintenance of the validated state, a stage in the validation cycle.
“In God we trust, all others must bring data“(1), is a quote often attributed to Edwards Deming (the creator of the eponymous cycle ) or Jack Welsh (the emblematic President of General Electric in the 1990s), which by itself embodies the spirit of the Six Sigma methodology: using data to control processes. Yet, Six Sigma suffers from its name – pronouncing it is difficult – and moreover conjures up acronyms – DMAIC – and roles – Green Belt, Black Belt, Champion – which can make this methodology seem obscure or even on the limit of the ‘sect’.

In its 2000 Annual Report(2), General Electric (GE) executives stated that “the Company not only posted its highest revenues ever, but grew them at one of the highest rates in its history. […] Through the rigorous pursuit of four big Company-wide initiatives – Globalization, Services, Six Sigma Quality and Digitization – we’ve changed not only where we work and what we sell, but how we work, think and touch our customers“.
Six Sigma cannot simply be summed up as common sense. Let us take a new look at it and understand how it can contribute to better mastery of manufacturing processes.
1. The history of 6 sigma
1.1 Craftsmanship: an Ancestral Mode of Production
Operational Excellence does not originate from Toyota and the Toyota Production System (TPS), nor from Motorola and 6 Sigma. It results from a long evolution of production methods enabling craftsmanship and then industry to continuously progress.
Until the industrial revolution of the nineteenth century, Western societies were predominantly agrarian and artisanal. To manufacture an item, you basically need to use a craftsman (a resource). This unique relationship (one item = one craftsman) has the advantage that each item manufactured is unique and corresponds exactly to the customer’s request. However, volumes are low and the costs high: one item = one cost, two items = two costs…. Although constrained by the resource until the arrival of mechanization, artisanal production continuously improved its organization.
1.2 The Renaissance: First Steps towards new Production Methods
In July 1574, King Henry III of France visited the city of Venice. On 24 July, “after making some purchases incognito, the king went to the arsenal. This heart of Venice’s commercial and military maritime power – overcame its natural shyness and fundamental distrust to show the sovereign the secrets of its strength – its best ‘arsenalotti’ (workers who achieve the feat of fitting out a galley in the time taken by the king to enjoy the light meal provided) and its incomparable organization combining efficiency and responsiveness“(3). King Henry III then discovered an incredible breakthrough in the way to manufacture: sequential work… which nowadays seems so natural.
At the end of the eighteenth century, these spectacular advances in manufacturing continued with the implementation of the Gribeauval system in the French artillery: “I owe my victories to this genius of Gribeauval“(4) declared Napoleon Ier. Jean Baptiste de Gribeauval [1715-1789] was appointed first French artillery inspector in 1776. He undertook a complete overhaul of his organization and ““imposed unique measures in all the provinces of France for the manufacture of weapons, a real revolution at a time when each region, and even each city, had its own measures! In foundries and arsenals, it also required the interchangeability of all parts and accessories between themselves, the quantified and standardized definition of a tolerance threshold for all machined parts and rigorous manufacturing controls, carried out according to precise specifications and thanks to control boxes containing templates common to all arsenals ““(5). The Gribeauval system is based on two principles: standardization and the mobility of parts.
1.3 Ford and Taylor’s Industrial Revolution
Inventor Eli Whitney [1765 – 1825] took up these principles and popularized them in the United States in the late eighteenth and early nineteenth centuries. He invented a cotton gin machine used to separate the cotton seed from its fibre, a tedious and costly task traditionally carried out manually by slaves in the southern United States. Beyond the technological advance, he offered an innovative marketing model: Eli Whitney sold the gin in standard detachable parts that were easy for the buyer to assemble. The foundations of mass productionwere laid: “ to make each part so very alike that any part of one can be used in any other“. Frederick TAYLOR [1856 – 1915] took inspiration from these technical advances in production, formalizing them in the decomposition of work into elementary tasks with fixed execution times. Meeting Henry Ford [1863 – 1947] was decisive. By combining Frederick Taylor’s work with assembly-line production, the latter moves from the world of the craftsman (low volume and high costs for custom products) to mass production (high volume and low costs for standard products).
1.4 The Birth of Probabilities and Statistics
In parallel with these technical advances, mathematics was also undergoing a revolution with the birth of probability calculation or the quantification of “chance” (from Arabic al zahr meaning … the die(6)). a fifteenth century Italian Franciscan friar, mathematician and founder of double-entry accounting [1445-1517]) posed the problem of division of stakes in his book Summa de arithmetica, geometria, de proportioni et de proportionalita” (Venice, 1494) : “A and B play balla [dodgeball]. They agree to continue until one of them has won six turns. In fact, the game ends when A has five points and B has three points. How should the initial stakes be distributed?“(7). Put differently, the question is: what decision should be taken to distribute the stakes knowing that A has five points, B three points and that the winner is the one with six points? This problem was addressed by many Italian mathematicians: Pacioli in 1494, Forestani in 1603, Calandri, Cardano in 1539, Tartaglia in 1556, Peverone in 1558, Pagani in 1591, and by Frenchman Gosselin in 1578.(8). But it was above all Blaise Pascal [1623-1668] and Pierre de FERMAT [≈1610 – 1665] who, during their correspondence in the summer of 1654, established the famous Pascal triangle – or binomial distribution – to calculate the theoretical probability of an event occurring Jacques BERNOULLI [1654-1705] continued in this direction with the law of large numbers drawn from his experience with “Bernoulli’s Urn”. He then assessed the probability of actual occurrence in order to estimate uncertainty: from frequency observations Jacques Bernouilli estimated reality..
Concretely, if I extract several samples of black and white balls from the urn, I can then estimate the actual proportion of black and white balls, i.e. calculate”the probability that the error between an observed value and the true value lies within a given limit“(9). French mathematician Abraham de Moivre [1667 – 1754]) took an interest in the work of Blaise Pascal and Pierre de Fermat and more particularly in “the convergence of random variables, from the following perspective: to what extent can we be sure that when we roll a die a large number of times, the observed frequency of appearance of the number ‘six’ tends towards theoretical probability? “(10). Abraham de Moivre notes a dispersion of the results around the mean, drawing a bell-shaped distribution: the normal Laplace-Gauss distribution. He calls this dispersion the standard deviation. “This measure is of crucial importance in determining whether a set of observations includes a sufficiently representative sample of the universe to which they belong“(11).
1.5 Motorola and Statistical Process Control
This approach to prediction using dispersion not only revolutionized mathematics but two centuries later also had a crucial impact on mastering manufacturing processes. Walter A. Shewhart – an American physicist [1891 – 1967] in charge of the technical department at Bell Telephone Laboratories – implemented control charts to ensure the quality of products manufactured at Western Electric’s Hawthorne plant. The results of his work were published in 1931 in his book Economic Control of Quality of Manufactured Product“, a reference still today for mastering manufacturing processes. It represents the birth of Quality Management..
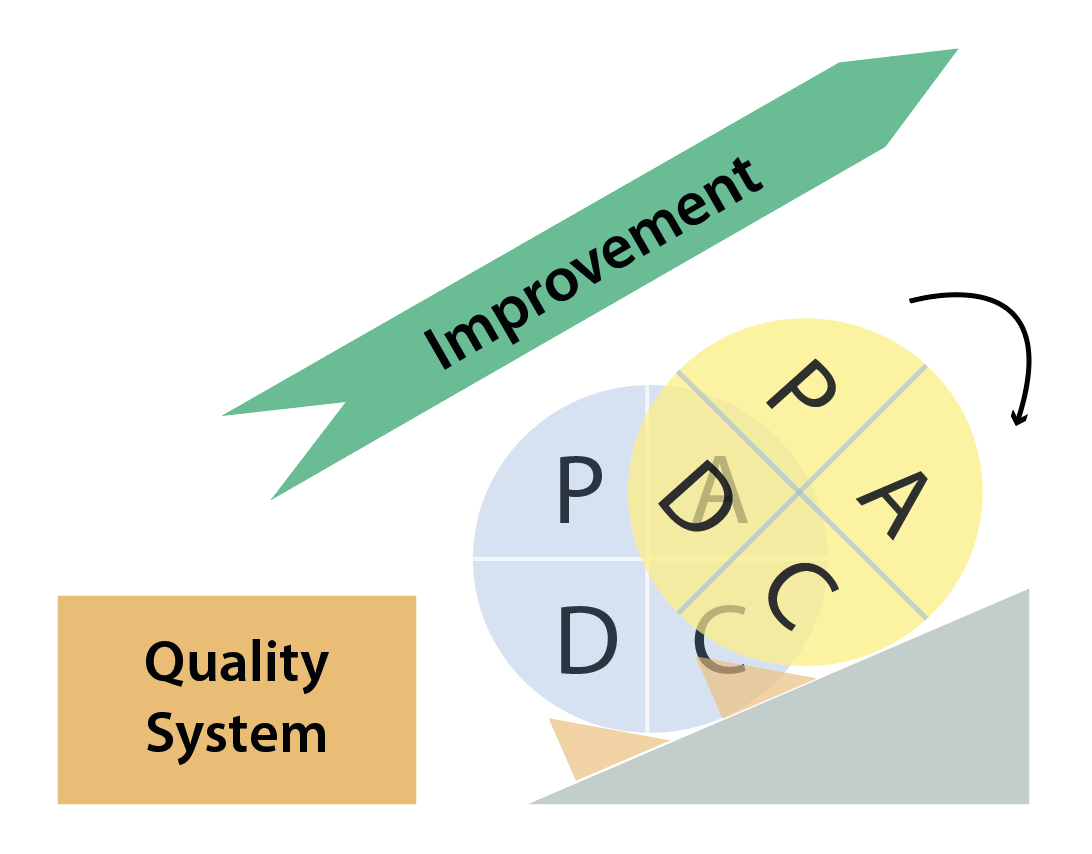
Mass production revolutionized manufacturing methods and, above all, made it possible to offer as many products as possible that were previously inaccessible or reserved for an elite. Mass production is good, but risky: manufacturing 1,000,000 similar vehicles entails the risk of repeating the same mistake 1,000,000 times. Very quickly, manufacturers became confronted with quality problems: product volumes increased … as did the errors. Walter A. Shewhart’s works provided tools to master manufacturing processes using statistics, the best-known being PDCA: Plan, Do, Check, Act or the Shewhart Cycle.
Edwards DEMING [1900 – 1993] came to popularize PDCA among Japanese industrialists in the 1950s. Nowadays, the PDCA is better known as the ‘Deming Cycle’ and is the cornerstone of the ISO 9001:2015 standard for Quality Management Systems: “The 2015 version is more oriented towards ‘results’ than ‘means’. Some documents are no longer required, such as the quality manual or system procedures. It is now up to the teams to determine their own operating means and tools. It is an opportunity to save time and promote your priorities. ISO 9001 and ISO 14001 standards adopt a common structure, organized according to PDCA (Plan-Do-Check-Act)“(12).
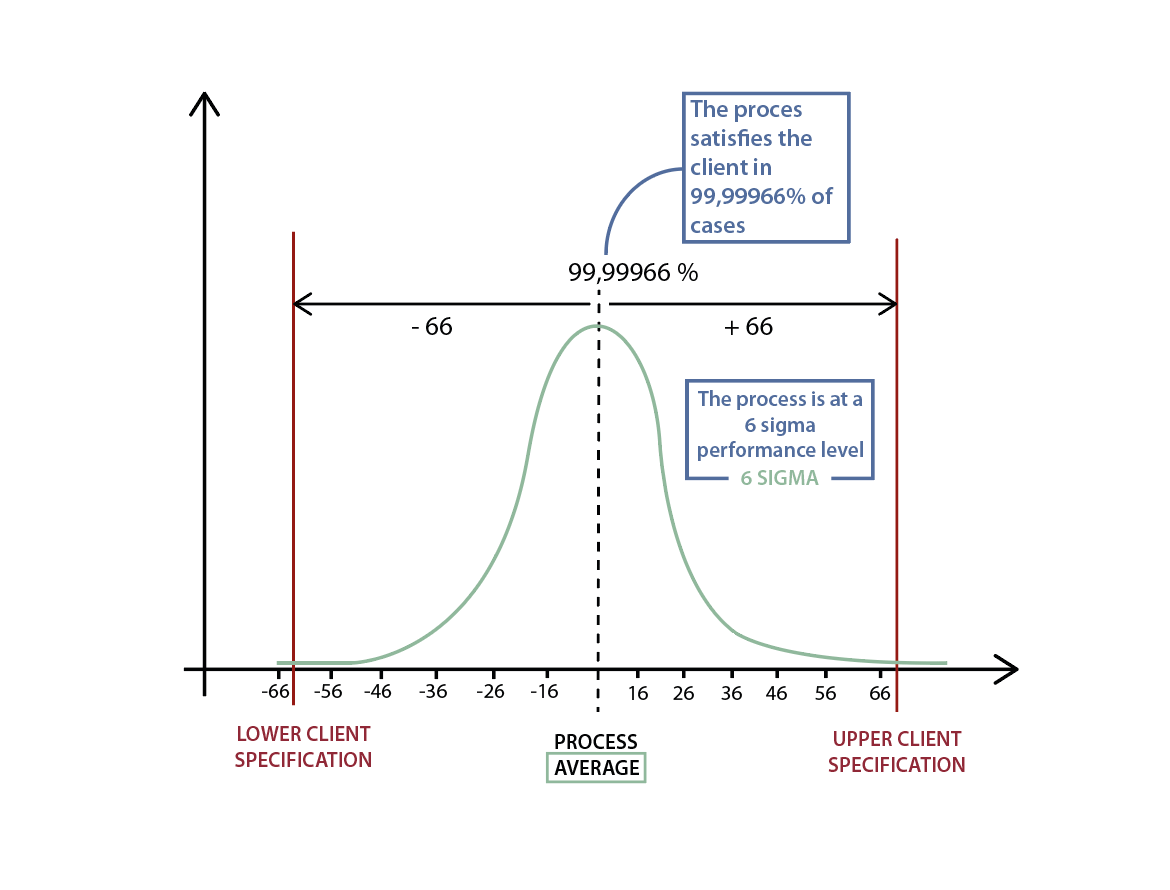
Bill SMITH [1929 – 1993], MOTOROLA’s Director of Quality Assurance, successfully connected statistical approaches to large-scale manufacture by creating Six Sigma, strongly inspired by Toyota’s Total Quality Management (TQM). He convinced Motorola’s management of his statistical approach in order to reduce defects in production lines and thereby increase quality … and results. The principle is statistically simple. For data following a normal distribution, Six Sigma considers that within a range of six standard deviations applied on either side of the mean, 99.99966% of the data(13) can be found (see adjacent figure). In other words, if a production line produces 1,000,000 parts and its quality level is Six Sigma, it will generate 3.4 defects for 1,000,000 parts produced – the objective that MOTOROLA set itself in the 1980s. Thus, Six Sigma was born..
1.6 The Dissemination of the Culture of Operational Excellence by General Electric
During the 1990s, General Electric and its emblematic CEO Jack WELSH generalized Six Sigma to all the conglomerate’s processes thanks to the Change Acceleration Process (CAP) and the change efficiency equation “E = Q x A” : the efficiency (E) of any initiative is equal to the product of the quality (Q) of the technical strategy and the acceptance (A) of this strategy by stakeholders. General Electric is focusing on increasing acceptance in order to sustain its initiative by training its employees in Six Sigma. Combining PDCA with the Change Acceleration Process approach, General Electric formalizes its approach using the DMAIC methodology: Define, Measure, Analyze, Improve, Control. Levels are created – Green Belt, Black Belt and Master Black Belt – according to the mastery of the methodology. These belts – once trained – lead problem-solving projects, train other belts“, and contribute to process improvement … a real policy of Operational Excellence that disseminates to all levels of the company. The results are not long in coming, as indicated in the introduction to this article: in its 2000 annual report(14), General Electric (GE) executives state that “the Company not only posted its highest revenues ever, but grew them at one of the highest rates in its history. […] Through the rigorous pursuit of four big Company-wide initiatives -Globalization, Services, Six Sigma Quality and Digitization – we’ve changed not only where we work and what we sell, but how we work, think and touch our customers“.
With statistical mastery of processes, the empirical approach (for each problem the objective is to find a solution ) becomes a scientific approach for each problem the objective is to find the root causes , – which is summarized by the equation Y = f(X1, X2, X3,… Xn) + ε where:
- “Y” is the unit of output from the process and delivered to the customer
- “f” is the process that generates the “Y”,
- “(X1, X2, X3,… Xn)” are the known root causes that influence the ‘f’ and therefore have a cause-and-effect relationship with the ‘Y’,
- “ε” is noise, i.e. what cannot be explained.
Let’s take the example of making a chocolate cake:
- “Y” is the chocolate cake;
- “f” represents all the tasks to be performed according to the recipe,
- “(X1, X2, X3,… Xn)” are the quantity of flour, sugar, eggs, the cooking time, oven temperature…,
- “ε” is what cannot be explained: “my grandmother makes the best cakes“.
If you check the cake when it comes out of the oven, you can tell if it is good or bad … but it will be too late if it is bad. You will have to cook a new one, hoping that this time it will be good. On the other hand, if you know that you must put between 50 – 55 grams of flour, 100 – 110 grams of sugar, 100 – 105 grams of butter, 200 – 210 grams of chocolate, 3 eggs and that the oven temperature must be between 180°C and 185°C and the baking time between 25 minutes and 30 minutes, then you will have a very high probability of success when making your cake … close to ε.The process output (Y) is determined by the inputs (X) when ε is small. Therefore, if you control the Xs, then you can reliably predict Y..
2. Example of the Application of Six Sigma in Industry(15)
2.1 For each problem the objective is to find the root causes
An industrial company manufactures agri-food products for everyday consumption. For one of its product ranges, its customers regularly report non-compliance in terms of the feeling or perception of the product consumed: there is not the expected flavour. This results in products being destroyed when the defect is detected by the factory and in consumer complaints when not. The objective is to identify the root causes that explain why the process generates defective products (flavour problem) and thereby control the root causes (the Xs) in order to reliably predict the flavour (Y): without methodology, it is like looking for a needle in a haystack. In order to avoid this pitfall, the factory takes steps to eliminate the defect identified by launching a project to control industrial variability using the Six Sigma – DMAIC methodology:
- Define : explain the problem, confirm its relevance to the company’s objectives, confirm the potential for benefit, build a project team;
- Measure : cunderstand the associated process, confirm the existence of the problem (reliability of the measurement, performance), consolidate the team;
- Analyze : identify the root causes of the problem, confront them with the reality on the ground, confirm with operational staff their impact on the process;
- Improve : encourage the emergence of solutions to eliminate or significantly reduce the problem;
- Control : ensure the sustainability and mastery of the solution, establish control tools, bring all the operational staff concerned on board.
The DEFINE and MEASURE phases explain and calculate the problem quantitatively by identifying the output produced by the process (Y, here the flavour) and the customer’s requirements, namely their objective and tolerance. If Y does not meet the customer’s flavour requirements, then the problem is proven. The calculation of the problem (or calculation of the process performance ) confirms its existence in figures: we move from feeling “every time it doesn’t work“, to facts “during the last twenty production runs, fourteen have not respected the customer’s requirements”.“. These two steps avoid starting up problem resolution if there is no problem.
The ANALYZE phase searches for root causes. To do so, process mapping is carried out with the operators and displayed in a room (see adjacent photo) throughout the project. This visual representation invites operators to indicate where they think a parameter can influence the flavour – the green post-it notes in the adjacent photo. Sixty-four potential root causes are identified. A plan to collect seventeen thousand pieces of data over a four-month period is then put in place.

Once the data has been collected, statistical analysis can then begin: a PLS (Partial Least Square) regression method is then used to evaluate the relationship between the response Y and the explanatory variables X (process parameters to be studied): Y = f(X1, X2, X3,… Xn) + ε. PLS regression is particularly suitable when there are many X explanatory variables and some variables correlate with one another. The principle of this method is to construct a model between the response Y and latent variables (each latent variable, also called component, being a linear combination of the initial explanatory variables). The modelling results then highlight the latent variables that best explain/impact the response Y. This method enables confirmation or invalidation of the operators’ intuition and five root causes are thereby identified statistically.
2.2 Control of the Manufacturing Process: Control Charts
The IMPROVEMENT phase : moving from statistical analysis to industrial reality. The impact of the five root causes on Y (flavour) is statistically modelled. This modelling calculates the tolerance limits , also called finished product specifications , that must not be exceeded by the root cause in order for the flavour to meet the customer’s requirements. From these tolerance limits, the manufacturer can also establish more demanding industrial specifications Indeed, the tolerance limits delimit the area beyond which Y will not meet the customer’s requirements. Keeping them as they are is risky: if your car is 180 centimetres wide, you will not build a garage 180 centimetres wide but at least 240 centimetres wide.
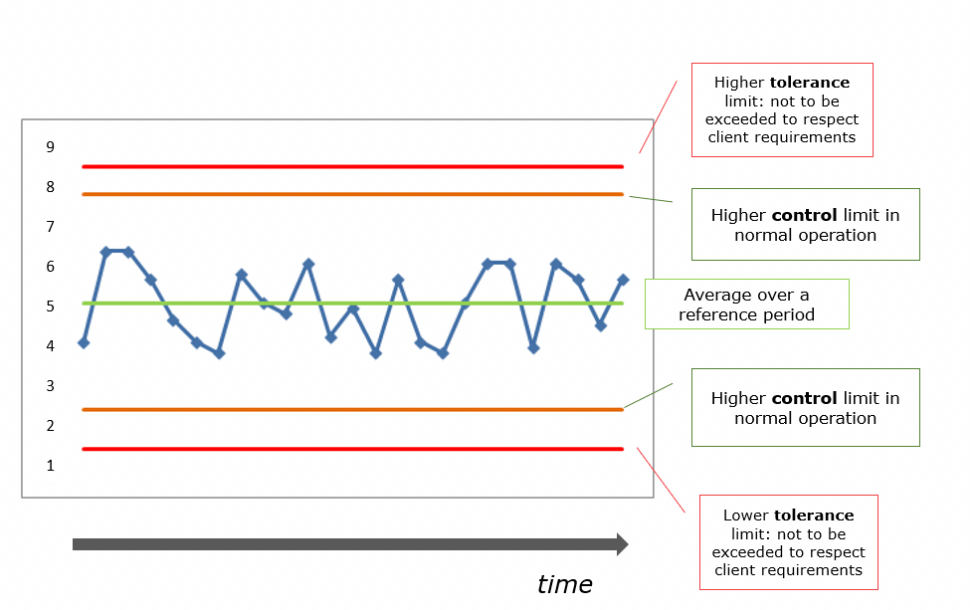
The CONTROL phase : from industrial reality to operational application. Knowing the limits not to be exceeded, the challenge is to ensure that the root cause respects these limits, i.e. that its variation is mastered in order to guarantee customer satisfaction. Mastery of this variation does not only require compliance with tolerance limits or industrial specifications, but mainly the possibility of detecting a trend that raises an alert of possible abnormal behaviour. This is the principle of Walter A. Shewhart’s control charts above: statistical mastery of processes. In the illustration above, the root cause evolves in a so-called control zone and shows no abnormal tendency: the data is normally distributed around the mean, with reference to the Laplace-Gauss distribution used by Abraham de Moivre, and are subject only to common causes, i.e. specific to the process itself. The process is under control, the operator is able to visually control it.
In our example, the analysis of the five root causes enables us to calculate tolerance limits, specify industrial specifications and calculate control limits for each root cause. The installation of control charts directly on the production lines enables operators to predict the defect … and thereby avoid it.
3. Six Sigma – an Analogy with Management
Six Sigma is often combined with statistics, which is true because they are very significant. Sometimes it is not easy to understand them: carrying out an experimental design or conducting an analysis of variance (ANOVA) requires good knowledge of the context in which these methods are used, as well as how to interpret the results.
However, reducing Six Sigma to statistical tools means believing in the existence of a single technical solution to every problem. A somewhat simplistic relationship of uniqueness: “We have found the solution, all we have to do is tell the teams to apply it“.
Why are we trying to solve a problem? To have an effect on customer satisfaction, process performance, efficiency of implementation etc…. A good technical solution will certainly contribute to this … if applied. In other words, if the teams do not use the solution, there is no point in looking for it.
Six Sigma is more than just a toolbox for solving problems. It does not provide a “miracle“. It searches for the root cause of the problem, places it under control using operational control and thereby prevents the problem from recurring. In the previous example, the manufacturer does not have a “miracle” solution. On the other hand, operators know the parameters (root causes) that influence the process. They have the means to control them (control charts) and are therefore able to master the process in order to deliver the right product/service to the customer. This combination of the “how” (the solution) and the “why” (the cause) increases the impact of the desired effect. It is the combination of the technical quality of the solution and the acceptance of this same solution: EFFECT = QUALITY X ACCEPTANCE. By implementing control charts – quantified mastery of the process – the manufacturer in our example has worked on acceptance in order to guarantee the flavour expected by their customers. “In God we trust, all others must bring data“(16).
Share article


Damien BONHOMME – 3CONSEILS
damien.bonhomme@3conseils.com
References
(1) En Dieu nous avons confiance, tous les autres doivent apporter des données
(2) GE Annual Report 2000 – page 4 – http://www.ge.com/annual00/download/images/GEannual00.pdf
(3) Marie Viallon. Les honneurs de Venise à Henri de Valois, roi de France et de Pologne : Etude du séjour vénitien du roi Henri III en 1574. Congrès annuel de la RSA, Apr 2010, Venise, Italie.
(4) “Gribeauval ou les débuts de la standardisation industrielle” – TRISTAN GASTON-BRETON HISTORIEN D’ENTREPRISE – LES ECHOS | LE 03/08/2016
(5) “Gribeauval ou les débuts de la standardisation industrielle” – TRISTAN GASTON-BRETON HISTORIEN D’ENTREPRISE – LES ECHOS | LE 03/08/2016
(6) “Against the Gods – the remarkable story of risk” de Peter L. Bernstein – 1996 – Edition Wiley p. 13
(7) “Against the Gods – the remarkable story of risk” de Peter L. Bernstein – 1996 – Edition Wiley p. 43
(8) LE PROBLÈME DES PARTIS BOUGE… DE PLUS EN PLUS – Norbert Meusnier – Université de Paris VIII – Electronic Journal for History of Probability and Statistics Vol 3 N°1 Juin 2007 – page 4
(9) “Against the Gods – the remarkable story of risk” de Peter L. Bernstein – 1996 – Edition Wiley p. 125
(10) Biographie d’Abraham de MOIVRE : http://www.bibmath.net/bios/index.php?action=affiche&quoi=demoivre
(11) “Against the Gods – the remarkable story of risk” de Peter L. Bernstein – 1996 – Edition Wiley p. 127-128
(12) AFNOR Certification “Guide de transition ISO9001 :2015 pour les petites et très petites entreprises” – novembre 2016
(13) Durant la vie d’un processus surviendra un décentrage (appelé “shift” en anglais) qui est estimé à 1,5 Sigma. On parle alors d’un Sigma long terme (LT) Vs un Sigma court terme (CT) où Sigma LT = Sigma CT – 1,5. Pour plus de précisions cf. “Six Sigma : comment l’appliquer” de Maurice PILLET / Eyrolles Août 2013 / Page 135
(14) GE Annual Report 2000 – page 4 – http://www.ge.com/annual00/download/images/GEannual00.pdf
(15) Les noms, chiffres et résultats ont été modifiés
(16) En Dieu nous avons confiance, tous les autres doivent apporter des données
Bibliography
“Against the Gods: The Remarkable Story of Risk” de Peter L. Bernstein – John Wiley & Sons / 29 septembre 1998
“The Machine That Changed the World: The Story of Lean Production- Toyota’s Secret Weapon in the Global Car Wars That Is Now Revolutionizing World Industry” de James P. Womack, Dan T. Jones et Daniel Roos – Free Press / 13 mars 2007
“Economic control of quality of manufactured product” de Walter A. Shewhart – Martino Fine Books / 25 avril 2015
“Six Sigma : Comment l’appliquer” de Maurice Pillet – Eyrolles / 29 août 2013
