
Summary
- 6 Sigma and Operational Excellence. Just Common Sense?
- How many values are necessary to have a representative sample?
- Statistical modeling: The need for a reliable approach to improve process knowledge and understanding
- Bayesian approach in cosmetical research : Application to a meta-analysis on the anti-pigmenting effect of vitamin C
- Comparability, equivalence, similarity… How statistics can help us to demonstrate these. And soon, the end of blind testing for health authorities and manufacturers.
- Maintenance of the validated state, a stage in the validation cycle.
In 2005, John Ioannidis, a researcher at Standford University School of Medicine in Palo Alto, California, asked the scientific community about the problem of false positives in research(1). This article was somewhat premonitory. A few years later in 2012, cancer researchers Glenn Begley and Lee Ellis reveal that scientists at the biotechnology company Amgen were unable to replicate the vast majority of published preclinical research studies.

Only 6 of 53 notable cancer studies could be replicated, a success rate of only 11%. Independently in 2011 Khusru Asadullah, Target Discovery Manager at Bayer and his colleagues, reviewed 67 goal validation projects, covering the majority of Bayer’s work in oncology, women’s health, and cardiovascular medicine over the last 4 years. They managed to find the results published in only 14 projects, less than 21% of cases, with very contradictory results for the other 43.
1. The roots of evil
In 2014, Regina Nuzzo, a statistician and science journalist published in Nature an article entitled “Scientific method: statistical errors”(2) which has since become one of the most read articles of the journal. She describes the genesis of the p-value by leading British statistician Sir Ronald Fisher in the 1920s, its incompatibility with the theory of decision making introduced by Mathematicians and Statisticians Jerzy Neyman & Eagon Pearson in the late 1920s, as well as the current practice resulting from a hybrid approach, NHST (Null Hypothesis Significance Testing), combining both theories and bearing in it the seeds of the current reproducibility problems. Since then many scientific institutions such as the US Academy of Sciences, the FDA, or publishers of major scientific journals have echoed this problem.
2. ASA statement and some proposals
In particular, in 2016, the American Statistical Association (ASA) published a statement on “Statistical Significance and p-values”(3) with six principles that underlie the correct use and interpretation of p-values. The publication of the article was followed by a congress dedicated to this theme a few months later in Bethesda. Since then, several propositions have been done.
A first proposition was a purely frequentist solutions such as a change from the 5% default threshold to 5 per 1000, in order to limit the false discovery rate to values closed to 5%(4).
A second proposition was to remove the significance thresholds(5) to allow a quantitative, non-binary, interpretation of the p-value. This quantitative interpretation was already suggested by Ronald Fisher who in his latest edition of “Statistical methods for research workers” wrote “strength of evidence against the hypothesis” to describe the p-value. The notion of significance is not as obvious as one might think. Quoting Andrew Gelman from Columbia University, “can we speak of significance when the difference between significant and not significante is not itself statistically significant”. Last but not least, rejecting a hypothesis makes sense only to accept another. However, the probability of a credible alternative is often lower than the probability of the null hypothesis that has been rejected.
The third proposition was a purely Bayesian approach suggested among others by Andrew Gelman(6) “we think the solution is not to reform p-values or to replace them with some other statistical summary or threshold, but rather to move towards a greater acceptance of uncertainty and embracement of variation”.
3. Prevalence and False discovery rate
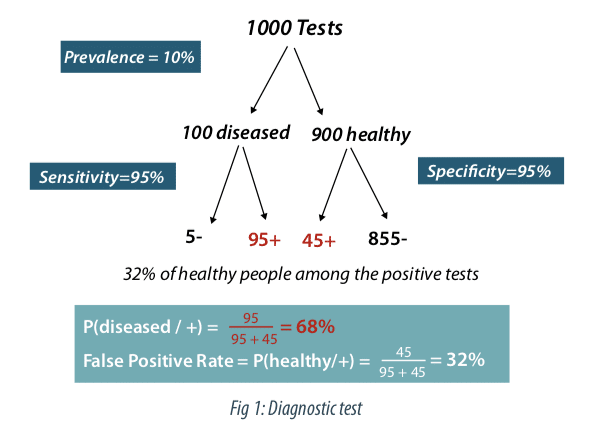
In an article entitled “An investigation of the false discovery rate and the misinterpretation of p-values, David Coquhoun, a researcher in the Department of Neuroscience at University College London, shows(7) using an analogy between diagnostic tests and clinical trials, the importance of prevalence, a factor not taken into account in the calculation of the p-value and which partly conditions the false discovery rate.
Figure 1 describes the case of a diagnostic test with a very good sensitivity (probability that the test is positive if the subject is non-healthy) and a very good sensitivity (probability that the test is negative if the subject is healthy). A prevalence of 10% of the disease is assumed in the study population. Out of 1000 subjects tested, we therefore have 900 healthy subjects and 100 non-healthy subjects. Among the 100 non-healthy subjects the test will be positive 95 times (true positive) and among the 900 healthy subjects the test will be negative 855 times (true negative), so positive 45 times (false positives). The percentage of false positives is therefore 45 / (95 + 45) = 32%. As a result, even with a very good test, in the case of a rare disease, the false positive rate can be surprisingly high.
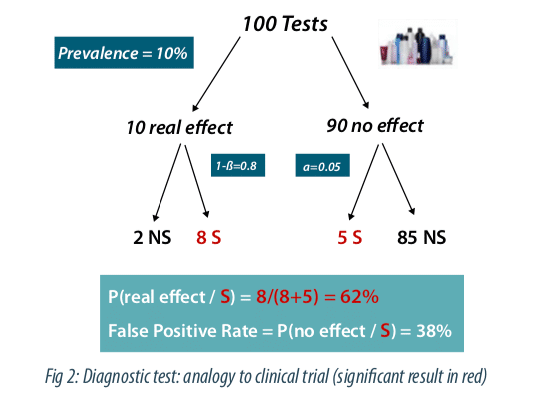
David Coquhoun proposes in his article to apply this reasoning by analogy to clinical tests. Figure 2 depicts the case of 100 clinical trials with a prevalence of 10% for the effectiveness of a tested asset class. This percentage can be estimated if we look at the percentage of molecules that will finally be validated at the end of the research process. The same logic as above can be applied by replacing the sensitivity by the power and the specificity by 1-alpha, with alpha the type I error, conventionally fixed at 5%. There are 8 true positives and 5 false positives corresponding to 5 / (8 + 5) = 38% false positives. Let’s note that this figure is much higher than the 5% generally wrongly assumed. Note that this false positive or discovery rate can strongly increase if the prevalence and / or the power decreases, in case of multiple comparisons or potential biases in the design of the study.
4. Supplement the p-value
Conscious for many years of this problem in the decision-making related to the p-value which is probably more to be seen as a descriptive statistic than a formal quantification of the evidence provided by the data, L’Oréal has sought to supplement the p-value by other indicators. These indicators are both descriptive: boxplots, effect size, confidence or credibility intervals. The goal is to give more importance to the estimation, but also to make a paradigm shift towards a Bayesian approach for a better consideration of sources of variability and sources of information, both internally and externally, potentially through elicitation. Probabilities of performance classes for the assets, previously defined in coordination with the clinicians, can be derived from the analysis. This Bayesian formalism allows risk calculations for future studies through probabilities of success. Encouraged by the pioneering work of Novartis, this paradigm shift today affects the entire pharmaceutical industry and should then extend to the cosmetic field. Illustrating the growing importance of these approaches in statistics at L’Oréal, a Bayesian meta-analysis on the anti-pigmenting effect of vitamin C is presented below(8).
5. Bayesian meta-analysis on the anti-pigmenting effect of vitamin C
We describe a meta-analysis of 31 randomized controlled clinical trials with more than 700 volunteers, assessing vitamin C on healthy skin in volunteers under UV daylight (UVDL)-simulated pigmentation in a standard protocol. A Bayesian meta-analysis of the skin-lightening potential of vitamin C was performed by dose and skin type population. This meta-analysis is based on the difference in Delta E between the vehicle and vitamin C at Day 12, the time point when the vehicle presents the higher pigmentation level. This corresponds to the maximum effect observed for vitamin C.
The efficacy of the vitamin C on UV-induced skin pigmentation was assessed based on the difference in Delta E between vitamin C and its vehicle, with Delta E, a distance in the CIELAB color space, defined as Delta E=√(∆L2+∆a2+∆b²) , where Δ represents the difference between exposed and unexposed treated areas.
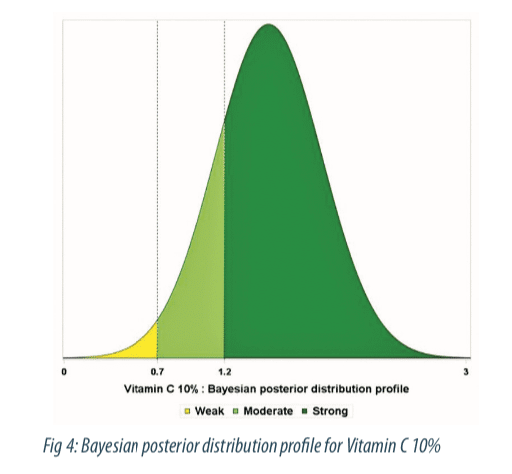
The aim of the Bayesian approach for the meta-analysis was to estimate the probabilities of belonging to performance classes for the vitamin C. Based on the correlation between Delta E and visual score of pigmentation on a 14-point scale, three performance classes have been defined by the clinicians: the non-perceptible effect, or “weak class”, (Delta E less than 0.7); the perceptible effect for a trained assessor or expert, or “moderate class” (Delta E between 0.7 and 1.2); the perceptible effect for a consumer, or “strong class” (Delta E >1.2).
6. Methodology
The interest of usi”ng a Bayesian meta-analysis compared to a frequentist one is to explicitly use probability distributions as a way to quantify uncertainties on the parameters. Let ∆∆Ej(i) represents the difference in Delta E between vehicle and vitamin C for subject j in study i. The model can therefore be written as: ∆∆Ej(i)=θ +εj(i), where εj(i)~N(0,ξi²). Let’s θi ~N(0,τ²) with vague prior distributions for the variance ξi² and the hyper-parameters θ and τ²: ξi²~IG(0.01,scale=0.01), θ~N(0,1000), τ²~ IG(0.01,scale=0.01). To derive posterior distributions for the parameters, conjugate sampling, when available, or random-walk Metropolis algorithm (Markov chain Monte Carlo method) were used to generate a sequence of draws from the joint posterior distribution. Credibility intervals for θi were graphically displayed using Forest plots as well as distribution profiles with associate performance classes. The Bayesian meta-analysis was performed using the Proc MCMC procedure from SAS ® 9.4 statistical software.
7. Results
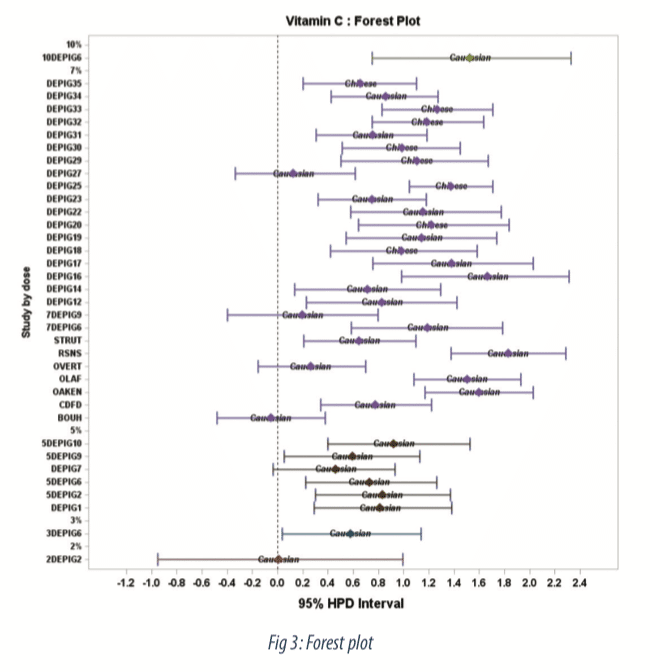
The Forest plot (Figure 3) shows estimates of treatment effect by study along with 95-percent credible intervals. We observe a dose dependent relationship with very low effect at 2%, moderate effect from 3% to 7%, and a strong effect at 10%. The probability to belong to performance classes for the 10% concentration is displayed in figure 4, as colored area under the curve (AUC). At the 10% higher concentration, the probability to observe a moderate and strong effect is 0.13 and 0.85 respectively.
Conclusion
Bayesian meta-analysis has gained popularity in the field of evidence synthesis of clinical trials. The Bayesian meta-analysis allowed us both to quantify the uncertainty associated with the estimation of treatment effects, taking into account intra- and inter-study variability, and to respond directly to clinicians’ expectations with the probabilities of belonging to performance classes. The Bayesian meta-analysis has shown that Vitamin C was effective in reducing pigmentation induced by UV daylight-simulated expositions in a dose-dependent manner(8).
Share Article


Philippe BASTIEN – L’OREAL
philippe.bastien@rd.loreal.com
Acronyms
NHST: Null Hypothesis Significant Testing
FDA: Food and Drug Administration
ASA: American Statistical Association
CIELAB: Commision Internationale de l’Eclairage LAB MCMC : Markov Chain Monte Carlo
AUC : Area Under the Curve
References
(1) John P.A. Ioannidis (2005), Plos Medicine, 2 (8) 696-701
(2) Nuzzo, R. (2014), “Scientific Method: statistical errors”, Nature, 506, 150-152
(3) Ronald L. Wasserstein & Nicole A. Lazar (2016), The ASA’s Statement on p-Values: Context, Process, and Purpose.The American Statistician,70 (2) 129-133.
(4) Benjamin et al. (2018) Redefine statistical significance Nature Human Behaviour, (2) 6-10
(5) Amrhein, V., Trafimow, D. & Greenland, S. (2019) Am. Stat.
(6) Gelman A, Carlin J. (2017), Some natural solutions to the p-value communication problem – and why they won’t work. JASA 112, 899–901
(7) Colquhoun D. (2014) An investigation of the false discovery rateand the misinterpretation pf p-values. R. Soc open SCi. 1:140216
(8) De Dormael et al. (2019) Vitamin C Prevents Ultraviolet-induced Pigmentation in Healthy Volunteers: Bayesian Meta-analysis Results from 31 Randomized Controlled versus Vehicle Clinical Studies. J Clin Aesthet Dermatol. 12(2): E53–E59.
