


Summary
- 6 Sigma and Operational Excellence. Just Common Sense?
- How many values are necessary to have a representative sample?
- Statistical modeling: The need for a reliable approach to improve process knowledge and understanding
- Bayesian approach in cosmetical research : Application to a meta-analysis on the anti-pigmenting effect of vitamin C
- Comparability, equivalence, similarity… How statistics can help us to demonstrate these. And soon, the end of blind testing for health authorities and manufacturers.
- Maintenance of the validated state, a stage in the validation cycle.
Because the production of biopharmaceutical products and the use of materials from mammalian origin for their manufacture carries a potential risk of presence of virus, viral safety is an essential factor in the manufacture of these products. Viral safety of biologics is an essential requirement for regulatory authorities, and to ensure the safety of the drug, inactivation and virus removal methods are required for production.

The European Pharmacopoeia(1) and the United States Pharmacopoeia(2) define the requirements for viral safety of biological or biotechnology-based medicinal products from animal or human materials. The various analyses carried out on the raw materials, the intermediates and the finished product do not make it possible to guarantee by themselves the absence of contamination and for this reason, as defined in ICH Q5A (R1)(3) it is essential to assess the capacity of the production processes to clear infectious viruses in order to guarantee the safety of the product.
The different international regulations require that manufacturing processes be designed and controlled to assure that in-process materials and the finished product meet predetermined quality requirements. And so, it is required for specific process steps to demonstrate the achievement of viral safety obtained by inactivation or virus removal methods.
This predetermined quality requirement shall be ensured consistently and reliably. What better way to demonstrate control of viral safety than building a predictive process modeling of the inactivation step, which results in a product meeting this attribute.
The way of demonstration consists of four major stages, illustrated in the opposite figure.

1. Modeling, what for?
1.1 Define the aim of the study: variable of interest and its acceptance criteria
Mathematical modeling must make sense in an industrial point of view, or for process understanding. To make sense, the first prerequisite is to define clearly the aim of the study:
- Process understanding: Identification of process parameters having an impact on product quality or process performance, and identify their level of impact (screening study) or knowing the rupture/failure points of the process
- Process optimization: The aim is to optimize the response to achieve process robustness. Acceptance criteria for the response is defined. The aim of this study is to find the best combination of acceptable ranges for the process parameters to obtain the desired response (e.g. CQA in its acceptance criteria).
Modeling is also interesting for existing process. Indeed, a predictive model can be implemented on a specifically step which must be under control, such as inactivation or virus removal methods.
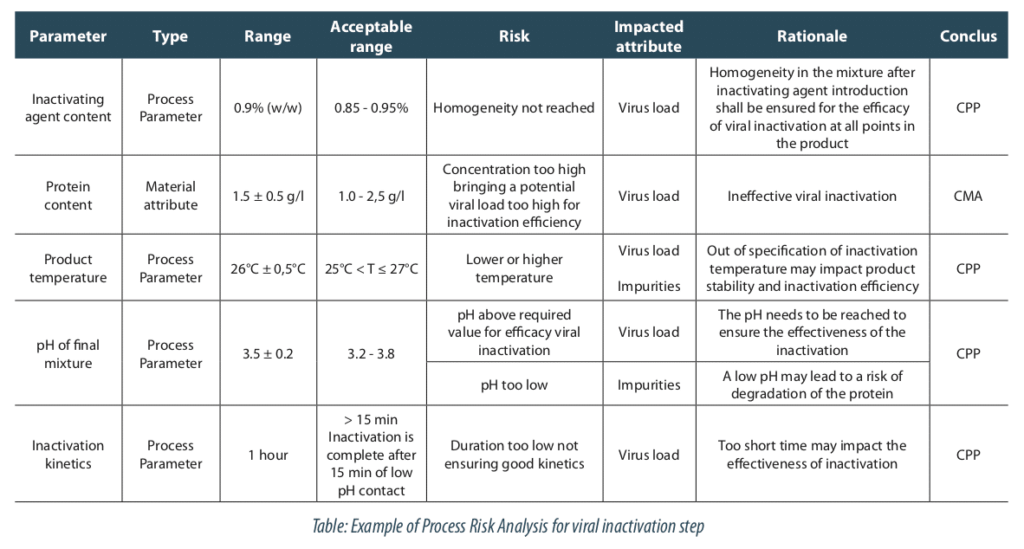
The case study presented here shows the modeling of a viral inactivation step. Our goal was to find the process conditions for which the viral load was destroyed at the end of the stage. Indeed, the viral load is a Critical Quality Attribute in the inactivation process. In connection with the Subject Matter Experts, acceptance criteria on viral load was defined, guaranteeing the quality of the downstream stages. Acceptance criteria on the variable of interest is a key element to drive the study and the interpretation of results.
1.2 Define potentially influential parameters
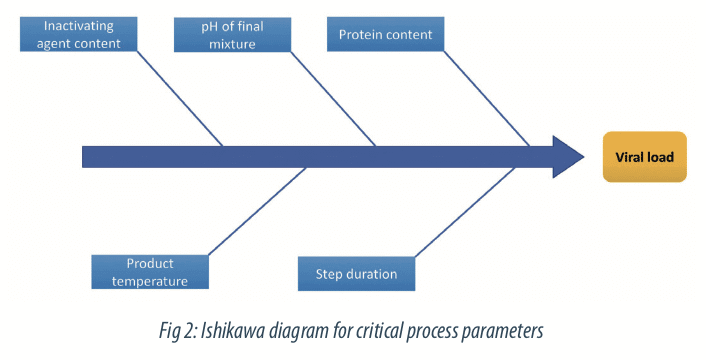
The first step on the construction of a Design of Experiment is the definition of the relevant parameters interesting to study. This step is crucial and should be done by a working group led by Subject Matter Experts and based on knowledge from literature or previous studies. Depending of the aim of the study (quality of performance), different tools can be used for the selection of relevant parameters.
The process risk analysis is a useful tool for this step. In our case, we selected the critical process parameters highlighted by the risk analysis. It shows five parameters contributing to the viral load reduction, as:
- the inactivating agent content,
- the protein content,
- the product temperature,
- the pH of final mixture
- the inactivation duration.
Other parameters, like conductivity, microbial load or density, were not identified as key for modeling so they will be maintained at their nominal level.
2. How to prepare the study?
2.1 Evaluate their domain of variation and the constraints of implementation
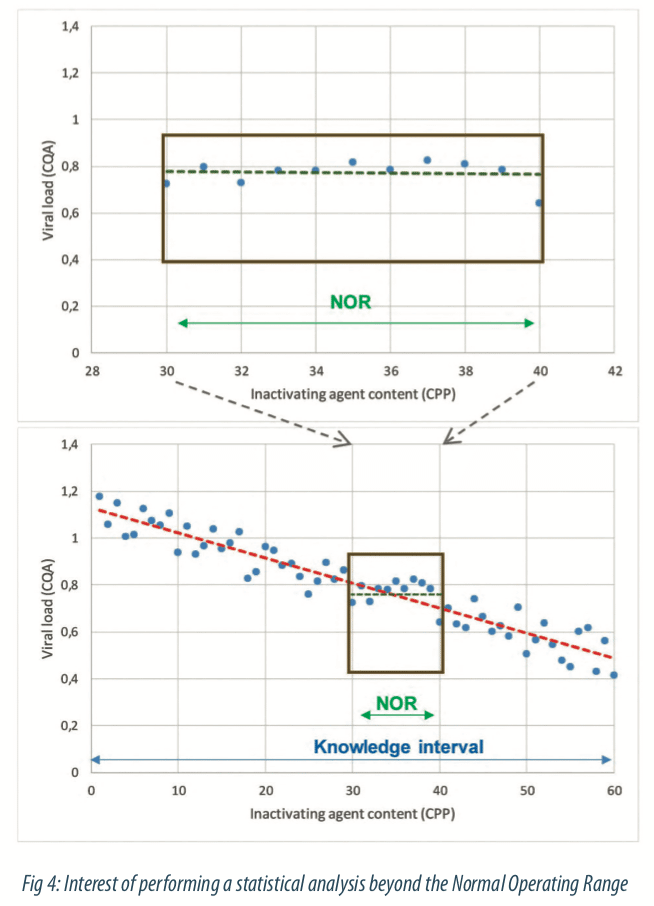
When relevant parameters have been selected, the next step is the definition of their variation domain. The other parameters, not relevant to study, are set at their normal operating set point. Modeling will provide information specially within the experimental domain tested. From this perspective, the definition of experimental domain beyond the Normal Operating Range is primordial to acquire knowledge about edge of failure.

Generate variability on process parameters or material attributes is necessary to understand how the CQA Viral load is evolving. Indeed, when only data generated from SPC tools (historical data) are taken into account to build a model, the information will be reduced and some critical parameters would not be highlighted because of the process control. Figure 4 below illustrates data generated among the monitoring: it seems that there is no link between the viral load and the inactivating agent content. In this case, the statistical model will not help to bring out effects of process parameters and quality of statistical model (part of explained variability by the model) will be poor. But if the variation domain is considered in a larger way, that is beyond the NOR, the relationship between viral load and inactivating agent content parameter can be brought out, as shown in the second figure. Data generated beyond the NOR enables to identify ranges in where process meet the quality and to increase statistical estimations of parameter effects within the NOR. Modeling requires to generate specific data beyond the Normal Operating Range of process, to identify feasibility limits of the process.
How is defined how far the study should go outside the Normal Operating Range? The exploratory domain beyond the NOR is defined with the Subject Matter Experts. Some limits are already known and this process knowledge helps to focus the study.
Another point to consider is the position of intermediate points of process parameters inside the boundaries of experimental range. Indeed, a balanced position within the experimental domain can prevent generating grey zones. Figure 5 below shows a model where modalities are not balanced in the experimental domain. Here, the parameter step duration has a positive impact on the viral load reduction: the longer the step lasts, the lower the viral load is. But a large part of the domain is interpolated without data and let a doubt about how the relationship occurs. In Figure 6 the experiences are well-balanced, and the potential errors brought out by the model is equally distributed. Moreover, central points can also indicate if the relationship is linear or not.

Finally, the intermediate points generated between the boundaries should be well balanced in the domain, even if this point does not represent the production target. In this case, adding a supplementary experience at the production target seems to be a better option than including it as a modality in the experimental design.
As far as possible quantitative parameters must be considered in experimental design rather than qualitative parameters. For example, studying the type of raw material (qualitative parameter) is less meaningful than studying a specific attribute of raw material (i.e. conductivity of a buffer, composition of the material, etc.). Sometimes it is not possible to identify a quantitative variable and qualitative parameters can be addressed thanks to the data analysis: in the case of qualitative parameters with fixed effect (e.g. Type of equipment, factor where all modalities can be tested exhaustively) the effect of each modality on the responses will be described in data analysis.
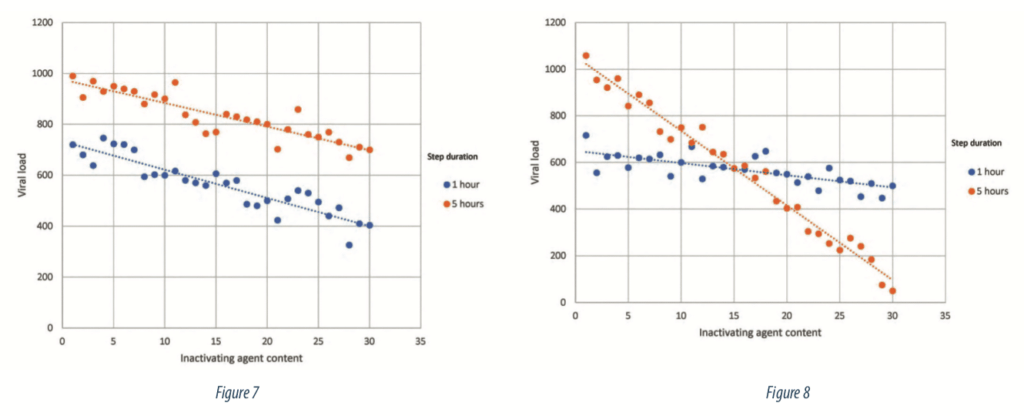
The final step to prepare the study is to evaluate the potential interactions between process parameters on the response. An interaction is a situation where the effect of one parameter on the response depends of the level of another parameter. Figure 7 illustrates a situation without interaction, the impact of the inactivating agent on the viral load is the same regardless of the step duration level: an increase of inactivating agent content leads to the same decrease of viral load. Parallel lines are the representation of a situation without interactions. On the other hand, Figure 8 shows a situation where the effect of the inactivating agent on viral load is depending of step duration level: an increase of inactivating agent engaged in the process leads to a more important decrease of viral load if the step lasts 5 hours than if it lasts 1 hour.
The number of relevant parameters, their types (quantitative or qualitative), their number of levels, their potential interactions are prerequisite elements to fix the number N of experiences to carry out in the Design of Experiment.
It appears that the best way to carrying out a process model is to generate data from a scale-down model. Implement a scale-down process is the only way to generate data out of parameter ranges quickly. Before carrying out modeling, the representativeness of the scale-down model regarding the industrial manufacturing process should be demonstrated.
2.2 Define the type of modelling and the data analysis strategy
The next step in the implementation of a process modeling is the definition of the type of modeling.
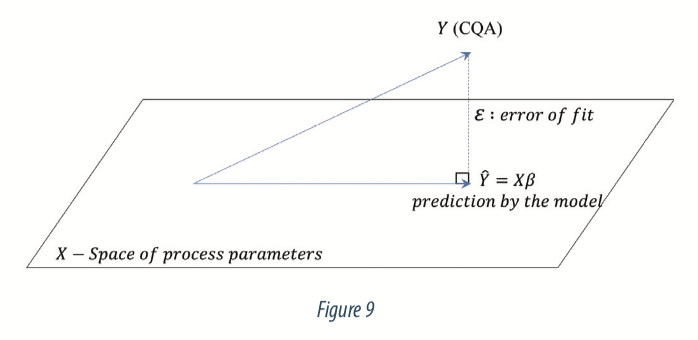
A model is an equation that links different process parameters or factors to a process response. An equation is a mathematical formula that can be expressed as follows:

With:
- i: the number of experiments,
- j: the number of parameters,
- Y: vector of n experimental results, here the viral loads obtained with the experiment,
- X: a matrix of size n x p, which is the experimental design matrix of values (n) for process parameters (p), or explanatory variables.
- β: vector of p coefficients estimated with the statistical modelling for each process parameters,
- ε: vector of n errors between the model prediction and the true value observed.
The model is a projection of the viral load (Y responses) into the space of process parameters (X). The projection is done so that the error ε is minimized. Figure 9 below illustrates the projection:
The equation below gives details about the algebraic form of equation 1:

Where:
- xij: are the known values of each explanatory variable (protein content, step duration, inactivating agent content, pH, …),
- βj: are the coefficients that should be estimated,
- εi: is the error between the observed value yi and the prediction of the model.
The equation 1 can be reduced from an arithmetic form to an algebraic form as below:

The equation 1 may include a lot of cases of relationships such as interaction (4), polynomial expression (5), of variable transformations [6]. See example with β3 below:

For quantitative parameters, the potential relationship with the response should be assessed regarding literature in order to provide the statistical model with quadratic or other polynomial coefficients.
In our case study, the equation took the following form:

The aims of a modelling are to:
- Give a good estimation of βj coefficients for the explanation of how the process parameters impacts the viral load (Y),
- Bring a good level of information to explain the variability observed on the viral load,
- Give a relevant equation based on n observations for the prediction of a new response based on new values of process parameters that have not be used for the estimation of the model.
3. How to provide data for modelling?
3.1 Build the Design of Experiments
For classical case study, the number of experiments (N) must be strictly superior to the number of parameters (p) of the model that must be estimated. The higher N is, the higher degree of freedom (Df) is, and the more powerful the model will be.
Note that if N is equal to p (that is Df = 0) the model will be in an overfitting situation (statistical terminology): that means estimation of model coefficients (βj) is possible, but significance evaluation of the model is not possible. Then, the study will be only descriptive and will lose its predictive goals for unknown future situations.
In case where the number of experiences N can be upper than the parameters to estimate (p), the question “what is the target for N?” can be assessed by Design Of Experiment methodology. This kind of approach enables to select relevant experiences to lead, avoiding the “one of factor a time” methodology which is expensive and may be without interest in the data analysis. The power of DOE approach is to provide the minimum of experiences leading to a model which will bring out the maximum of information on the study. Figure below shows the contribution of a DOE approach versus a one-factor-at-time methodology in the exploration of the knowledge domain.

A lot of type of DOE exists (Box-Behnken, Taguchi, Doehlert, D-optimal…) and it depends of the aim of the study and the type of data. Several statistical software contains automatic modules that enable to generate easily a lot of kind of experimental design. Nevertheless, this operation should be achieved jointly between the statistician and the subject matter expert to guarantee a relevant choice of experimental design. Then the statistical power of the experimental design should be evaluated, that means the probability of the plan to bring out real effect of parameters.
Carrying out a DOE approach permits to browse experimental domain in an optimized way and lead to a robust model. Indeed, the confidence level on the coefficients (βj) estimated on data from a DOE approach will be better. DOE approach leads to construct a model which minimize the error on prediction. 3.2 Perform the tests The feasibility of the experimental design built with statistical tool should be challenged by one or more experts. Sometimes, one factor can be difficult to change from an experience to another. In usual case, the factor protein content is the most difficult variable to vary. The experimental design is organized to consider this constraint, regrouping the experiment by level of protein content.
When carrying out the experiments, every change or notable points should be precisely recorded for an eventual help in the data interpretation.
3.2 Perform the tests
The feasibility of the experimental design built with statistical tool should be challenged by one or more experts. Sometimes, one factor can be difficult to change from an experience to another. In usual case, the factor protein content is the most difficult variable to vary. The experimental design is organized to consider this constraint, regrouping the experiment by level of protein content.
When carrying out the experiments, every change or notable points should be precisely recorded for an eventual help in the data interpretation.
4. How to use the model?
4.1 Analyse results, conclude on the ranges allowing to reach the criterion on Y
When all the data planned in the DOE are collected from the scale down process, the statistical data analysis can start. The first step must always be descriptive analysis. Despite the simple aspect, this step is very important to ensure global coherence of data and to eventually highlight outliers. Graphic representation may be helpful to assess this part.
The first thing to do when the model is built is to verify the global quality of the model. This can be assessed with statistical indicators (coefficient of determination R², predictive validity coefficient Q², residuals analysis…) and traduce the part of Y variability that the model can explain. If the quality is good, it means that a large part of variability observed on the response can be explained with the identified parameters and material attributes, and then the analyst can go further. If this criterion is not met, this can be due to a missing parameter which has not been identified in the first step. That is why, the selection of parameters and material attributes with multidisciplinary is primordial step: it conditions all the analysis.
When the validity and the quality of model has been verified, the analysis can start, parameter by parameter. Depending on the number of parameters involved, this part can be realized with iterative method (such as Stepwise) to select parameters that have a statistically significant impact on the response. It is recommended to keep involved the Subject Matter Experts during this part and to proceed manually if needed, specially in case of interactions.
For each parameter or material attribute, the impact on the response can be identified and the degree of the impact (positive, negative, strong, low…) can be quantified.
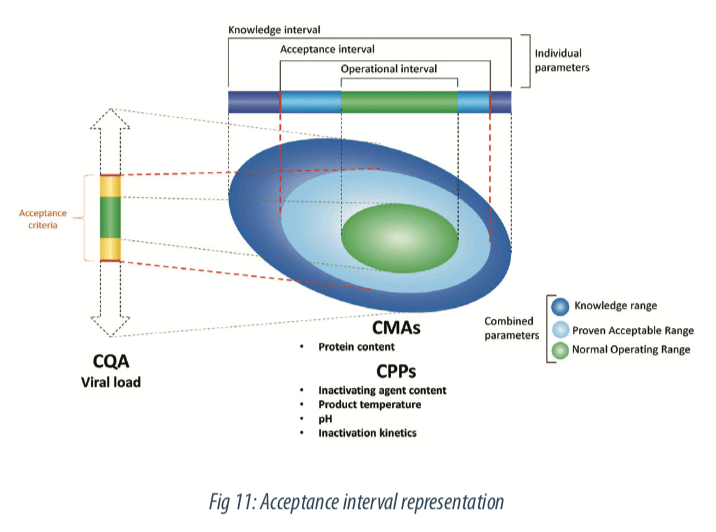
The prediction equation will be composed of all significant parameters with the estimated coefficients. With this equation, intervals of predictions can be built for the evaluation of new values of process parameters. Then, the criteria defined on the viral load during the study preparation step enable to define a theoretical space on process parameters, that ensure the quality of the variable of interest. That means, acceptance intervals can be defined on step duration, inactivating agent content, protein content, pH of mixture and product temperature and predicts a theorical acceptable viral load at the end of the step. Figure below illustrates this step.
4.2 Perform additional tests to confirm the statistical model
Before using the model for prediction, a confirmation study (also called scale-down model qualification) is necessary to confirm that conclusions observed on the scale-down process are transposable to the industrial process. Intervals of prediction may be useful on this part for example by collecting data on industrial process and compare the process responses observed to the intervals of predictions of the model.
Modelling is very useful to justify the number of batches for initial process validation (the famous “three batches”). If model is available, then few validation batches are enough to provide a good level of confidence that the process will run consistently in commercial production phases.
4.3 Starting point for a relevant monitoring
In the way of process understanding, modeling can be a starting point to acquire knowledge on product and process and to combine a predictive approach with a control approach.
The equation resulting from the model is not frozen in time and can be alimented by the data collected with the establishment of a monitoring. It could also be a key tool in case of a process transposition on a new site: the advantage is to be able to evolve the process in terms of control of the studied parameters.
Finally, modeling opens the way to a continuous process verification (e.g. innovative approach of process validation). It will be possible to envisage the implementation of an optimized approach of validation of the process during changes. This new validation approach allows, under the guise of a reinforced monitoring (monitoring of critical parameters and attributes relevant qualities as a function of time, but also in multivariate), not to restrict itself to the first batches of validation but to release continuously batches as they are implemented and analyzed.
This is a powerful tool for process understanding in the future and a leading opportunity to combinate multidisciplinary knowledges and competences.
Share Article


Mannaïg MACUMI – AKTEHOM
mannaig.macumi@aktehom.com
References
(1) Eur. Ph 5.1.7 – Viral Safety
(2) USP 1050
(3) ICH Q5A(R1) 1999 – Viral safety evaluation of biotechnology products derived from cell lines of human or animal origin
Guidance for Industry – Process Validation – 2011
Guideline on process validation for the manufacture of biotechnology-derived active substances – 2016 – EMA/CHMP/BWP/187338/2014
Régression Théorie et applications, Pierre-André Cornillon Éric Matzner-Løber, Springer – 2006
Plans d’expérience : constructions et analyses statistiques,
Mathématiques et Applications, W. Tinsson, Springer 2010
Acronyms
DOE: Design Of Experiments
ICH: International Council for Harmonisation of Technical Requirements for Pharmaceuticals for Human Use
USP: United States Pharmacopeia
SME: Subject Matter Experts
NOR: Normal Operating Range
CQA: Critical Quality Attribute
CMA: Critical Material Attribute
CPP: Critical Process Parameter
SPC: Statistical Process Control
Df: Degree of freedom
