


October 2023
La Vague n°79
Special A3P Congress 2023 : Annex 1, Environmental and process monitoring
Table of Contents
- EU GMP Annex 1 (2022): Aseptic Process Simulation (APS). New challenges for the pharmaceutical industry?
- How to evaluate pyrogenic risk in an injectable pharmaceutical process? Decision-making tool
- Introduction to the dual chamber systems (DCS) filling process
- Implementation of decontamination processes in the pharmaceutical industryentation of decontamination processes in the pharmaceutical industry
- Container Closure Requirements in the New EU GMP Annex 1 - Enabling Compliance with a Holistic Science-Based Approach
- Improving the efficiency & reliability of AVI qualification: Determining the optimal number of runs with the KNAPP method
- Case Study: Effective Sterile Powder Transfer for Parenteral Drug Products
Improving the efficiency & reliability of AVI qualification: Determining the optimal number of runs with the KNAPP method
According to the regulatory requirements, qualification of an automated inspection machine consists in demonstrating that performance with respect to the detection of known faults is equivalent to or better than manual inspection. The most commonly used methodology is the Knapp & Kushner method.

This article is limited to particulate faults and the data presented are for illustrative purposes only.
1. Knapp and Kushner: The method for comparing manual inspection with automated inspection
During the installation of an inspection machine on the LEO Pharma site in Vernouillet, it was natural to use this qualification method. The Knapp & Kushner method consists of two parts: manual inspection and automated inspection. The results of these two parts are then compared.
a) Manual inspection: Establish the benchmark performance
The first step was to define the detection performance of manual inspection. It constitutes the benchmark used to evaluate automated inspection.
A test kit was made up comprising of 10% of units with a particulate fault and 90% compliant units. This ratio avoids a potential bias during manual inspection. The particle types known from routine production were included in the test kit: particles of glass, stainless steel, piston seal, different plastics and fibers. Each particle type was also represented by several sizes “e.g.: piston seal particles between 50μm and 1000μm”.
For the manual inspection of the test kit, 5 authorized inspectors representative of the global panel were selected. Each inspector inspected the test kit 10 times, documenting the result for each unit inspected. After the manual inspection, the 50 results obtained per unit were used to calculate the individual PoDs (Probability of Detection: “0% – 100%” detection).
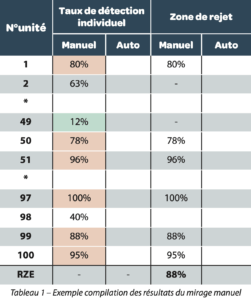
Table 1 – Sample compilation of manual inspection results:
We then were able to classify each unit within one of the following three categories:
- 0% ≤ PoD < 30% : Acceptance zone
- 30% ≤ PoD < 70% : Gray zone
- 70% ≤ PoD ≤ 100% : Reject zone.
The zone of interest for the next part of the Knapp study is the reject zone. The particles in this zone are used to calculate the mRZE (Manual Reject Zone Efficiency) which represents the performance of the manual inspection. This manual Knapp inspection indicator represents the detection mean of units with a detection rate of 70% and over.
mRZE = (Sum of the PoDs of units with a PoD≥70%) / (number of units in the reject zone)×100%
Table 1 shows a sample compilation of manual inspection results. All detection rates of 70% or over are taken into account in calculating the manual inspection RZE. Detection rates below 70% are excluded from the calculation.
b) Automated inspection: Achieving the performance level of manual inspection
The second step is the calculation of the aRZE (Automatic Reject Zone Efficiency) of the automated inspection machine. The acceptance criterion is based solely on the units in the reject zone defined by the manual inspection study. The mean of the detection rates of units in the automatic reject zone must be equal to or higher than the manual detection rate, aRZE ≥ mRZE. The units in the acceptance and gray zones may also be evaluated on the automated inspection machine for information purposes.
aRZE = (Sum of the PoD for automated inspection of units with a PoD ≥70% for manual inspection) / (number of units in the reject zone) ×100 % ≥ mRZE
The units were inspected in a loop in front of the inspection stations 50 times. A report was then published, it indicates the detection rate per unit.
Table 2 shows an example of the calculation of the aRZE. Only the units in the manual inspection reject zone are taken into account in calculating the aRZE. We can see that the units in the manual inspection gray zone or acceptance zone, with a detection rate of 70% or over for automated inspection are not taken into account in calculating the aRZE (e.g., unit 2). Conversely, units detected at a rate of less than 70% by automated inspection, and present in the manual inspection reject zone are taken into account (see unit 99).
We can then compare the automatic RZE with the manual RZE.
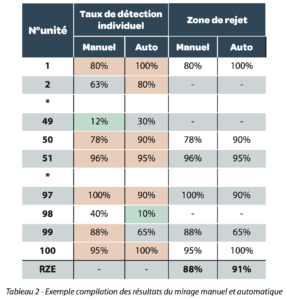
Table 2 – Sample compilation of manual and automated inspection results
More information on the qualification method can be found in the A3P CIG Visual Inspection Guide: VOL. No. 12 // Sept. 2022 // “Good practices for the implementation of an automatic visual inspection process for injectable products” (available on the site www.a3p.org/guide-scientifique-technique/).
c) Confirmation of detection by image analysis and the emergence of a problem
The images of the units considered non-compliant by the inspection stations were recorded during execution for subsequent verification. Because of the acceptable presence of bubbles and micro-bubbles in our product during the inspection process, we wanted to ensure that the detection rate of defective units was linked to the particulate fault.
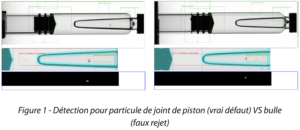
Figure 1 – Detection for piston seal particles (true fault) versus bubble (false reject)
Thus, the last step was to confirm the detection rates obtained by image analysis. This verification proved very time-consuming. In fact, the first tests showed that around 4,000 image sequences had been saved!
This is explained by the fact that each unit had been inspected by several cameras 50 times. Not being able to act on the “number of units” and “number of cameras” factors in order to reduce verification time, this problem led us to question the number of inspections that needed to be carried out for each unit. Could we reduce the number of inspections? How many inspections are required for the RZE to be considered statistically representative? 10 times is often mentioned, a minimum of 30 or a number identical to manual inspection (50 in our case). But is there a representative method for the minimum number of passages?
2. The Knapp and Abramson tables
a) Study
To provide a representative method for the minimum number of passages, we can refer to the study of Knapp and Abramson, described in the manual, “Liquid – and surface-borne particle Measurement handbook” by Julius Z. Knapp, Thomas A. Barber and Alvin Lieberman. In the study, Knapp and Abramson describe a method for validating the number of inspections needed to demonstrate an “equivalent or better performance” in a significant manner.
The Knapp and Abramson validation experiments were demonstrated by repetition and the statistical results of these experiments were expressed in tables. Several tables were produced, in line with different inspection methods (e.g., MVI vs. AVI, MVI vs. AVI followed by a repeat AVI inspection). In this article, we will limit ourselves to the MVI vs AVI tables. The tables are divided into three categories: RZNI – 1.0, RZNI – 1.1, RZNI – 1.2, shown in Figure 2.
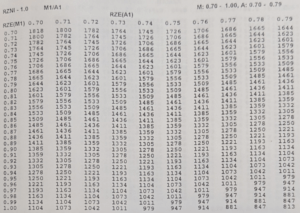 | 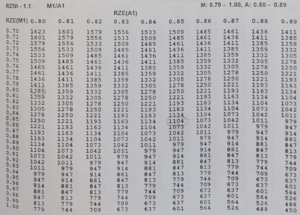 |
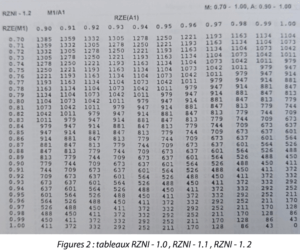
Figure 2: Tables RZNI – 1.0, RZNI – 1.1, RZNI – 1. 2
These tables are the result of Knapp and Abramson’s statistical study. In this study, the minimum number of inspections of units in the reject zone to compare 2 inspection methods was defined with a 95% confidence interval. So, these tables give us the confidence statistically to determine the sufficient number of inspections for qualification units. We can refer to the book “Liquid – and surface-borne particle measurement handbook” to obtain a mathematical explanation of these tables.
To use the tables and to determine the number of test kit inspections, three elements are needed:
- The mRZE (=RZE(M1) in the tables), representing the manual inspection performance.
- The number of defective units in the reject zone.
- The expected aRZE (=RZE(A1) in the tables), representing the expected performance of automated inspection.
After manual inspection of the test kit, the detection rates are known and can be expressed by probabilistic values between 0 and 1. Given the nature of the mRZE, its value is always as a minimum 0.70. The first column of the RZNI tables displays values between 0.70 and 1.00 These values represent the mRZE that can be obtained, between 70% and 100%.
The number of units in the reject zone is also known once the manual inspection has been carried out.
The expected performance for automated inspection, the aRZE, should then be defined. It may be estimated with the following indications: experience with a similar, already qualified, product, the results of feasibility studies, configuration data from the visual acceptance test ….
In the case where it is not possible to estimate automated inspection performance, the minimum performance can be defined. In fact, to qualify automated inspection, we must show that the aRZE is equivalent to or better than the mRZE. In this case, we can take an aRZE that is equivalent to the mRZE. The first line of the RZNI tables displays the expected aRZE. RZNI Table – 1.0 presents aRZE from 0.70 to 0.79, RZNI Table – 1.1 from 0.80 to 0.89 and RZNI Table – 1.2 from 0.90 to 1.00. The aRZE will thus determine the table to be used to determine the minimum number of inspections.
Once the mRZE, the number of units in the reject zone and the expected aRZE are known, we can determine the minimum number of unit inspections with one of the RZNI tables (1.0, 1.1 or 1.2). A constant N is given by the intersection between the mRZE in the first column and the aRZE in the first line. Then, the minimum number of inspections of the test kit is given by the following formula:
I= N/RZN
I : Number of test kit inspections for a 95% confidence interval
N : Constant given by the Knapp and Abramson tables
RZN : Number of samples in the reject zone
b) Practical case
Let us take an example of an mRZE of 88% with 80 units in the reject zone.
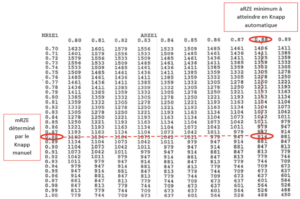
N/RZN=I , 914/80=11.42 , that is 12 inspections
This practical case shows that the number of inspections of test kit units can be greatly reduced.
We can also see that the number of units in the reject zone can have a large impact on the number of test kit inspections. In our example, a mRZE/aRZE of 88% with 80 units in the reject zone requires a minimum of 12 inspections. The same mRZE/aRZE configuration of 88% with 30 units in the reject zone would require 31 inspections. We can also see that the poorer the mRZE/aRZE performance, the higher the required number of kit inspections and vice versa. In our example, the same configuration of 80 units in the reject zone with an mRZE/aRZE of 75% would require 21 inspections.
3. Conclusion
Use of the Knapp and Abramson tables allows the rational determination of the minimum number of inspections during manual and automated qualifications. By using the Knapp and Abramson tables, we reduced the number of passages in the inspection machine and therefore the number of images to be verified. Thus, the execution time for automated qualification was greatly reduced.
There is a valuable benefit in using these tables also for the manual Knapp inspection in order to reduce the time and the cost associated with its execution. The difficulty may lie in estimating the mRZE and the number of units in the reject zone before conducting the manual Knapp inspection.
However, the experience acquired during the manual inspection studies already conducted may be useful for this estimate. Good practice would nevertheless be to inspect the test kit a few more times to ensure that results fall within the Knapp and Abramson tables.
Share the article

References
- Generalized methodology for Evaluation of parental inspection procedures (Julius Z. Knapp and Harold K. Kushner, PDA J Pharm Sci and Tech 1980, 34 14-61)
- Automated particulate inspection systems: Strategies and implications (Julius Z. Knapp and Lee R, ABRAMSON, J Pharm Sci and Tech 1990, 44 74-107)
- Evaluation and Validation of Nondestructive Particle Inspection Methods and Systems (Julius Z. Knapp, Thomas A. Barber and Alvin Lieberman, Liquid- and surface-borne particle measurement handbook 1996, 295 – 450)
Glossary & abbreviations
- aRZE Automatic Reject Zone efficiency
- AVI Automated Visual Inspection
- mRZE Manual Reject Zone efficiency
- MVI Manual Visual Inspection
- PoD Probability of Detection
- RZE Reject Zone Efficiency
- RZN Number of contains in Reject Zone
- RZNI Reject Zone Number of Inspections

