
Summary
- Influence of the hardness of bacteriological culture media on environmental monitoring with impaction type air samplers.
- A New Rapid Microbiology Method based on Measuring Oxygen. Depletion: An Assay for Testing Surfaces of Equipment, Facilities, and Personnel in Pharmaceutical Manufacturing Controlled Environments
- Development of platform processes for the manufacture of Biopharmaceuticals.
Microbiological controls of the environment in clean rooms are now included in most recommendations and regulatory documents. For example, in the guide “Bonnes Pratiques de Fabrication (BPF)”(1) it is recommended that limits and values of microorganisms in the air and on the surfaces are applied in the different clean room classes (A-D).

This guide is the French translation of the guide for European Good Manufacturing Practice (2). In the hospital environment, the French standard NF390351 imposes microbiological values of the air and surfaces based on defined risk environments.
The proposed revision of ISO 14698 also includes a classification of the controlled atmosphere according to the clean room classes. The revision was not approved, but provides an opportunity to include new methods for the detection of microorganisms in the air and surfaces. Additional approaches other than impaction and cultivating methods are available, and alternative sampling and analyses methods permit the detection of microorganisms without cultivation.
During an interactive roundtable held in October 2014 by A3P (3-4), in a discussion about the possible modification of the Annex 1 (5-6), it was asked whether “the microbiological qualification be added to particulate qualification”? The response was a very strong 58% against, and 34% in favour.
Current standards or recommendations are not based on proven processes, and microbiology is a science which shows that many parameters can influence the results. The growth of microorganisms on a culture medium poured into Petri dishes is dependent on many factors: the quality of the collection (e.g. impaction efficiency); the influence of the transfer of samples; and factors related to the microbiological analysis, e.g. the quality of the culture medium, the temperature, time of incubation, and the possible growth of the germs in a media.
The aim of this study is to determine the influence of the surface condition of agar Petri dish culture on microorganisms after impaction using different impaction samplers. Preliminary tests (7) show a significant difference between different samples after the results of the microbiological analysis.
Materials and methods:
Environment tests:
For the studies it was necessary to have a sufficient level of contamination in order to achieve measurable results (between 30 and 300 colonies per plate). This protocol was conducted in laboratory rooms without special air handling (uncontrolled atmosphere).
Air samplers:
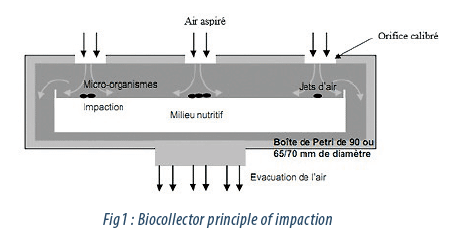
For this study, 4 impactor type air samplers from 3 different brands with the same specification were used. These devices are conventionally used as microbiological air samplers to monitor the biocontamination in the air (Fig.1). The particles from the air, after passing through a specific sieve plate of each device, are impacted onto the surface of a culture medium poured into the Petri dishes. The Petri dish is then incubated and the colonies formed are counted.
The devices were used at a flow rate of 100 litres/min and a sample volume of 500 litres was collected. Twenty-four tests of 5 minutes per sampler and per type of agar have been performed.
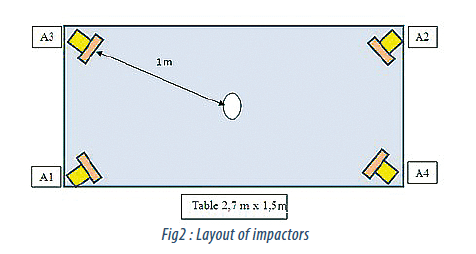
The impaction samplers were set according as shown in Fig. 2. The impactors were placed up-right on the bench and the heads were directed towards the same focal point. The minimum distance between each head and the centre point was one meter. Various tests were made by alternating the media and to avoid interference between the impactors.
Culture medium:
The basic medium used for this study is an agar culture medium Tryptic Soy Agar (TSA). This medium can be used for cultures and isolates of aerobic and anaerobic bacteria. This is a universal medium suitable for many applications due to its excellent nutritional properties.
This medium also respects a number of quality criteria summarized in the table below (Tab. 1):
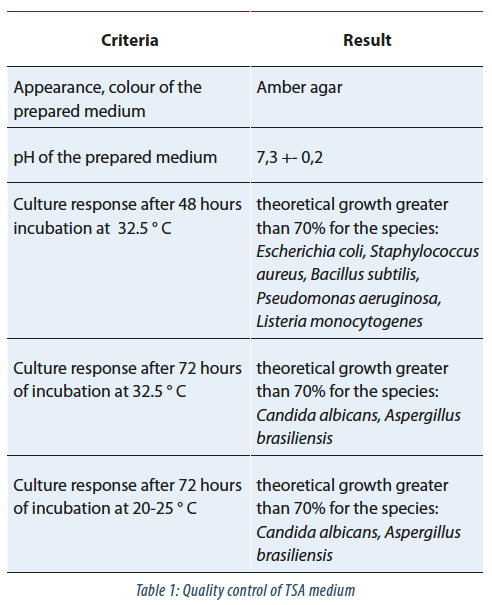
The ready-made Petri dish for environmental use must be stored between 2 and 8 °C (or other temperatures depending on the manufacturer’s recommendations), protected from light and should be used before the expiry date.
Measuring the surface condition of the agar:
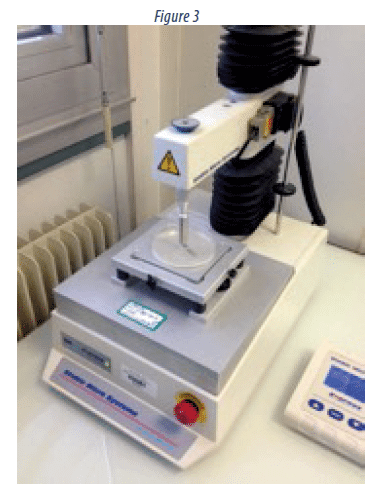
As part of this study, the hardness of the TSA medium was measured through a TA.XTplus Texture Analyser (Fig. 3), which is an analytical instrument of Stable Micro Systems. It is able to measure practically any product for its physical characteristics such as hardness, fragility, adhesiveness, resistance of the gel, and the elasticity of foodstuffs, cosmetics, pharmaceuticals, gels, adhesives and other food products. The hardness is the minimal force in g/cm² to decline on the structure of the Agar. This is a physicochemical control for characterizing the hardness of agar.
Agar is deposited in the centre of the apparatus, a monitor starts the cycle for measuring the hardness of the agar, the piston goes down at a constant speed until it reaches the agar and breaks it up. This indicates the hardness of the Agar.
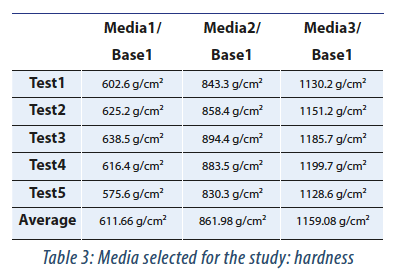
On preliminary tests we tested 5 different Agar with two different sources which allowed us to find different hardness levels (Tab. 2).
Following preliminary testing hardness test. it was decided to select areas 1. 2 and 3 below (Tab. 3):
These media were chosen because they are made from the same TSA source and the hardness results allowed to name these Agars “soft media”, “semi-hard media”, “hard media” – named media 1, 2 and 3, respectively. Furthermore, these batches comply with the same quality control.

Method of incubation:
288 agars used for this study were incubated at 32.5 ° C in an incubator, the Petri dishes were positioned upside down and the colony counting took place after 48 hours of incubation.
Counting Method:
To obtain significant results, it is necessary that the number of CFU per Petri dish is between 30 and 300 CFU. On the bottom of the Petri dish, every CFU was marked with a permanent marker pen and the colonies were divided into bacterial colonies or moulds. Counting was performed manually, Petri dish by Petri dish.
Statistical elements:
Statistical analysis was carried out using StatEL software developed by ad Science.
To visualize the results obtained by the Friedman test the result are shown in graphic charts. The scale of values of the variable is located on the vertical axis. Q25 represents 25% of the value, Q75 represents 75% of the value and the median represents 50% of the value.
Results:
As part of the study on the influence of the surface condition of an agar Petri dish, 96 test using 3 different hardness levels of agar were performed. Four different impactors with the same characteristics were used.
The statistical elements (Tab. 4) of the 288 values were calculated using the StatEL, from Excel tables combining data sources. All statistic values have been rounded to the nearest unit.

From the graph (Fig. 4), we note that the agar “hard” with a hardness level of 1159 g / cm² has an average number of CFU per Petri dish of 86, the agar-called “medium-hard” with a hardness level of 862 g / cm² has a number of 101 CFU per Petri dish, and the agar-called “soft” with a hardness level of 620 g / cm² has a number of 131 CFU per Petri dish.
From the data obtained, StatEL allowed to make a Friedman test, to measure whether the deviations obtained between the different types of agar are significant:
Working hypotheses, comparing samples in pairs:
H0: the averages of two samples studied were not significantly different.
H1: the average of the two test samples are significantly different from each other.
Results of the Friedman test:
Hard vs Semi-hard:
The workforce and the number of measures are sufficient to compare the index F Chi² distribution.
Chi² = 4.642 with a degree of freedom; p = 0.031.
The Friedman test to reject H0, the risk of error p <0.05.
The two series are compared differ significantly from one each other; the probability that the deviations are due to chance is less than 4%.
Semi-hard vs Soft:
The workforce and the number of measures are sufficient to compare the index F Chi² distribution.
Chi² = 41.779 with a degree of freedom; p < 0.01.
The Friedman test to reject H0, the risk of error p <0.05.
The two series are compared differ highly significantly from each other; the probability that the deviations are due to chance is less than 1%.
Hard vs soft:
The workforce and the number of measures are sufficient to compare the index F Chi² distribution.
Chi² = 47.253 with a degree of freedom; p < 0.001.
The Friedman test to reject H0, the risk of error p < 0.05.
The two series differ compared very highly significantly from each other; the probability that the deviations are due to chance is less than 1 per 1000.
The results are visualized with graphics boxplot below (Fig. 5):
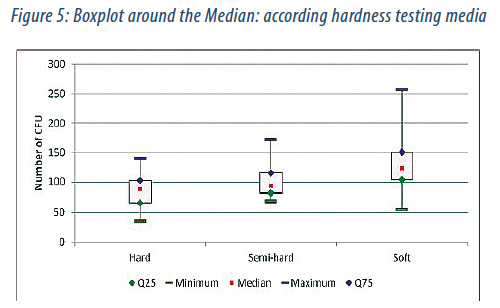
According to Figure 5 there is a different number of CFU for the three hardness levels, 88 CFU for hard agar, 94 CFU for medium-hard agar and 123 CFU for soft agar. However, there is a more asymmetrical distribution for soft agar as for hard and semi-hard agar.
In order to verify that the results are not influenced by the equipment used, a statistical calculation in an Excel spreadsheet was performed for each individual instrument (Tab. 5).
From the data obtained, the StatEL software allowed for a Friedman test, to measure whether the differences obtained between the different devices are significant.

Work hypothesis:
H0: the averages of different test samples are not significantly different.
H1: among averages of different test samples, at least one is significantly different.
Results of the Friedman test:
The workforce and the number of measures are insufficient to compare the index F Chi² distribution.
We therefore refer to the Friedman table to test the validity of the calculated F : 5.8
F lim : 7,.4
p : NS
The Friedman test does not reject H0 at the risk of error p < 0.05.
No series is distinguished from others. Viewing these results with graphics boxplot. (Fig. 6):
From Figure 6, it is found that the distribution appears symmetrical with very close values of median: 2406 to A1, A2 to 2298, 2351 to 2630 for A3 and A4. Furthermore, no impactor is known to have a large amplitude relative to others.

Discussion:
Figure 4 shows the mean number of CFU per Petri dish according to the hardness of the agar. The number of CFU is proportionally decreasing compared to the hardness of the agar Petri dish during impaction.
Indeed the agar called “hard” with a hardness level of 1159 g / cm² has 86 CFU per Petri dish, the agar called “medium-hard” with a hardness level of 862 g / cm² has an average of 101 CFU per Petri dish and the agar called “soft” with a hardness level of 620 g / cm² has an average of 131 CFU per Petri dish.
The Friedman test based on the results obtained confirms that there is a significant difference between hard and soft agar and this with a risk probability of less than 0.1%.
The Friedman test on the performance of equipment shows that there was not a significant difference between the impaction samplers (p>0.05) (Fig. 6). This reduces the influence of different impactors on the results obtained on agar in Petri dish.
Conclusion
From the results obtained, it seems obvious that the growth of microorganisms on a culture medium is dependent, in the case of the impaction method, on the hardness of the agar.
This study concludes that there is a correlation between the surface condition of an agar Petri dish and the cultivation of microorganisms, as part of an impaction. This study formally demonstrates that in the case of a rather hard agar, the impaction seems to be less effective than in the case of a soft agar. It is impossible to use impaction as a method to consider microbiological classification of a cleanroom. The impaction should only be used for monitoring.
The study also shows that it is necessary to obtain reliable information from the manufacturers of impactors and manufacturers of culture media on the different hardness levels of the agar.
Finally, other methods such as cyclonic samplers or thick membrane filtration can supplement or even replace the impaction method. New procedures for rapid analysis can replace traditional microbiology methods involving culture. Finally, molecular diagnostic techniques or biological particle counters could lead to new ways for more straight forward microbiological air monitoring.

Michel THIBAUDON – RNSA
michel.thibaudon@wanadoo.fr

Julien CLERTANT – ANALYZAIR
Partager l’article
Bibliographie
1. ANSM, Bonnes pratiques de fabrication, Bulletin official n°2014/1bis, Fascicule spécial
2. Eudralex Volume 4, EU GMP Annex 1. Manufacture of sterile medicinal products; Novembre 2008.
3. Guinet R., Les contrôles environnementaux suite aux rencontres de Microbiologie, La Vague n° 35, 17-19, septembre 2012.
4. Guinet R., Résultats du vote sur les propositions du GIC A3P de modifications envisageables de l’Annexe 1, La Vague n°44, 7-8, janvier 2015.
5. Guinet R., Propositions du GIC A3P Annexe 1 pour la révision de l’Annexe 1, La Vague n°46, 33-35, juin 2015.
6. Guinet R., Propositions de modifications spécifiques de l’Annexe 1, La Vague n°47, 27-32, septembre 2015.
7. Thibaudon M., Est-il possible de procéder à une classification microbiologique d’une salle propre ? Salles Propres, n°100, 26-29 2015
