


Summary
- Product transport risk analysis
- Risk Management for Avoidance of Drug Shortages
- Major outcomes of the common A3P/ECA/PHSS/AFI/BPOG Survey on current industry practices for the inclusion of Local Isolates in the GPT & on-going discussions on the relevance of that expectation
- How to design a digital transformation architecture at Life Sciences organizations
- Antibiotic powders Maximum safety & efficiency during filling
- GMP 2022 et la vapeur du procédé de stérilisation. Bien comprendre comment épargner temps et argent
- Optimisation de l'évaluation du risque chimique dans l'industrie pharmaceutique. Le rôle des outils de modélisation de l'exposition aux agents chimiques dangereux
PRODUCT TRANSPORT RISK ANALYSIS
For active substances, excipients and, of course, intermediate and finished products, quality risks must be assessed throughout the manufacturing and distribution chain. This involves assessing the risks involved in transporting the product, its materials and components.
In general across the sector, companies have made significant progress in controlling internal risks, yet there has been less attention given to the risks associated with external suppliers and transportation. Consequently, there’s a pressing need for the pharmaceutical industry to address this gap in risk management. The ICH guideline Q9 on quality risk management provides tools for assessing these risks. This article aims to highlight some of these tools.
The aim of quality risk management tools is to rate, but not mitigate, the risks of microbiological and particulate contamination and the loss of its physico-chemical characteristics of the material in question. Tools may also consider other risks, such as the degradation of the primary packaging article (often the sterility barrier claimed) or secondary packaging (causing problems with product conservation and stability or leading to traceability and labelling faults).
The approach presented in this article has three advantages. Firstly, it uses tools that are simple and familiar to everyone; in this case, the DMAIC method (Define, Measure, Analyze, Improve, and Control).
Secondly, it is scalable. In a first iteration of risk assessment, the main risks will certainly have been identified, but it is possible that some minor risks that are difficult to detect and quantify may have been omitted. These minor risks can always be incorporated into a new iteration using the same tools.
The third advantage, and by no means the least, is that the known risk analysis tools enable managers from different sectors, or with different sensitivities, to adopt the method and effectively communicate it internally, as well as to auditors and inspectors. This is beneficial as complex methodology can be difficult to explain during regulatory inspections, whereas this intuitive process makes risks easier to understand, communicate and present.
Finally, a simple risk analysis process will help to control these risks, making them easier to understand, encouraging buy-in from the various stakeholders and facilitating awareness. We shall now look at this risk analysis process in greater detail.
1. Risk Analysis Process
Distributors, transporters and storage intermediaries can be controlled and monitored on the basis of this risk assessment, which will make it possible to define the qualitative elements to be integrated into the supply chain to manage the risk correctly. Studies and scientific data can be used to support the analysis.
Certain stages will have to be validated if the assessment justifies it; for example, by simulating transport conditions or carrying out stability studies under stressful conditions.
Historical data collection (supplier audit discrepancies, anomalies, and complaints) can be used to define an occurrence. However, this study of the data is not enough as we also need to list all the failure scenarios, some of which did not occur. To identify and list all the potential risks, we need to know what caused them. To be as exhaustive as possible, the 6M methodology and knowledge of the contamination triangle will be effective tools for cataloguing all failures and their probable causes.
But what do we mean by transport risk analysis? Transport risk analysis involves identifying each risk, evaluating it (and therefore constructing a rational rating system) and finally entering the process of reducing the risk and estimating the residual risk (Figure 1) within the scope of the transport operation. It is important to define, in advance, the stages that need to be considered in this analysis. Ultimately, this will depend on the scope of your study. We can mention, without being exhaustive, all the stages outside of manufacturing which involve the physical removal of the product from the premises: storage and warehousing, as well as the transport of the product between different buildings on the same manufacturing site; or between different production or distribution sites. This list is not exhaustive – it’s up to you to define exactly which stages you want to include in your study.
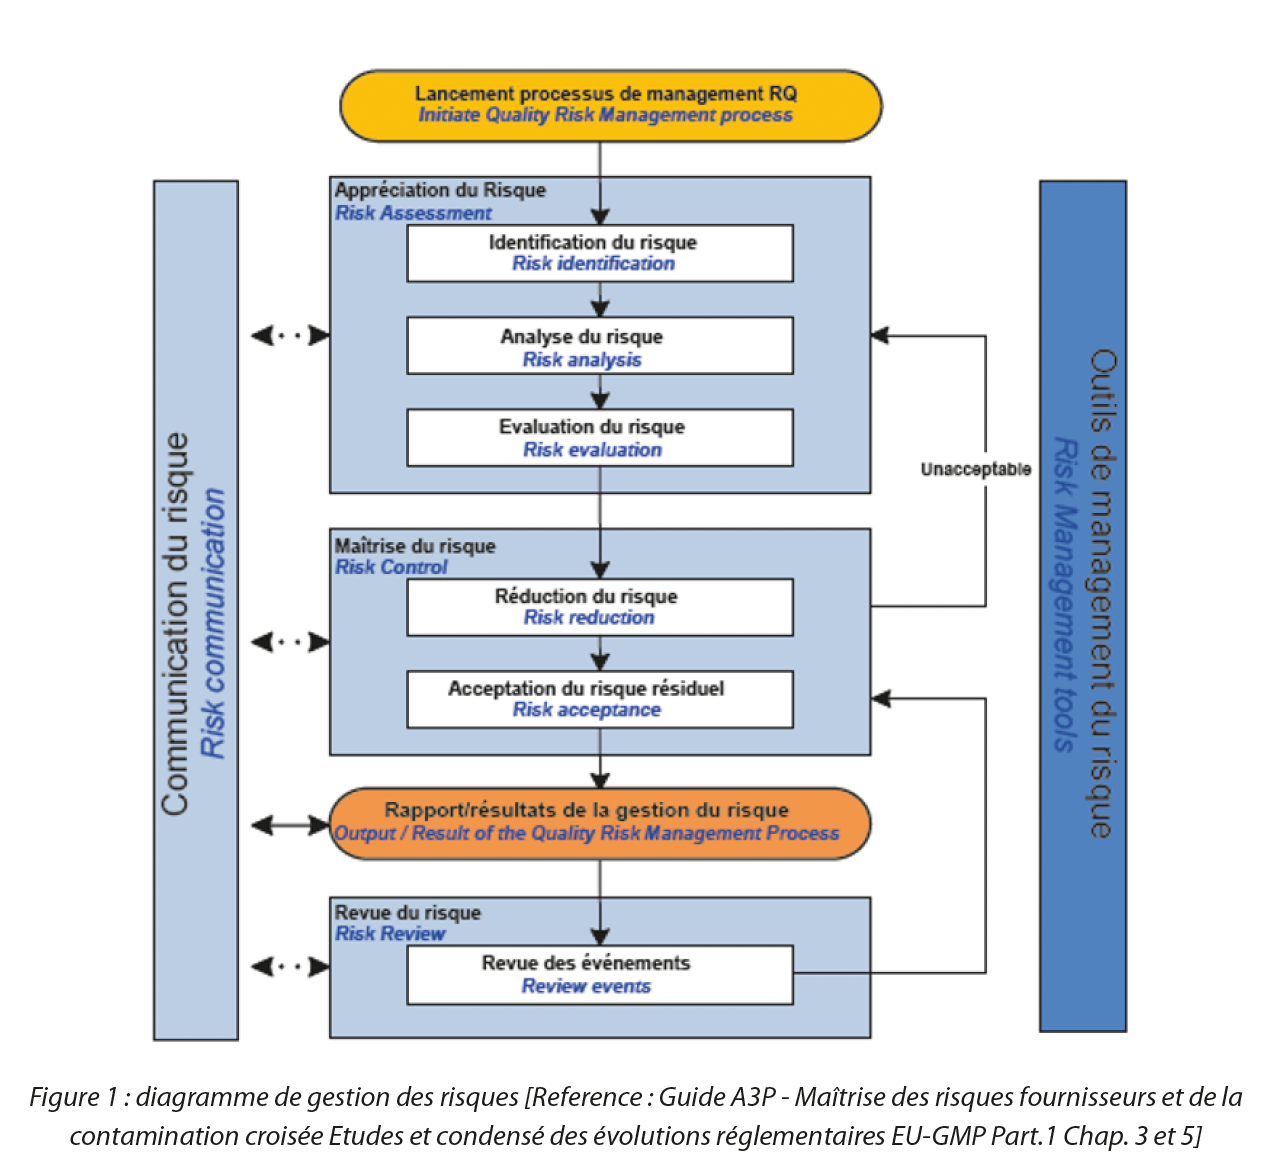
Figure 1: Risk management diagram
First, you need to make two choices: What is the ultimate objective of this analysis, and what is its scope? By correctly defining the final objective and the scope, you will avoid getting lost in the complexity of certain processes and flows.
Generally, the aim of a risk analysis is to ensure that the quality assurance (QA)/quality control (QC) system for transport conditions is effective in delivering to the patient a finished product that complies with the regulatory dossier (Marketing Authorisation). It must be effective, stable, homogeneous, and safe (i.e. sterile, pyrogen-free and free of particles for injectable medicines). However, there are two pitfalls to consider. Firstly, that risk analysis is not a validation of transport. On the contrary, it should be the start of it. The aim of the risk analysis is to define a transport validation master plan. Secondly, risk analysis must not be used to justify bad practice or non-compliance with a regulatory requirement. In the following section, we take a detailed look at the risk analysis methodology.
2. Analysis methodology
Using the recommendations of the ICH Q9 framework for formalising, documenting and rating the risk management process, the method we shall focus on is based on the principle of a multi-criteria analysis.
This assessment strategy integrates the principles and methodologies of four approaches. The first is the DMAIC method, renowned for its effectiveness in assessing product risks. Its familiarity and clarity facilitate seamless risk management throughout the transportation phases.
The DMAIC method uses three well-known risk analysis tools:
- The 6M principle to list all failures and their probable causes.
- The contamination triangle (Figure 2) to guide the assessment criteria for chemical, cross-contamination, microbiological, pyrogenic and particulate contamination risks. As a reminder, standards ISO 13408-1, ISO 14698 and NF EN 17141 indicate that contamination is effective when a source of contamination is transferred by a vector. These standards require complete identification of the sources of contamination, knowledge of the type of contamination emitted and an estimate of its concentration. By knowing the sources and vectors present at each stage, we can therefore determine the types of contaminants emitted, their concentrations and their probability of transfer to the receptor.
- The FMEA method (Failure Mode and Effects Analysis) to identify failures, rate their severity, estimate their occurrence and their level of detectability.
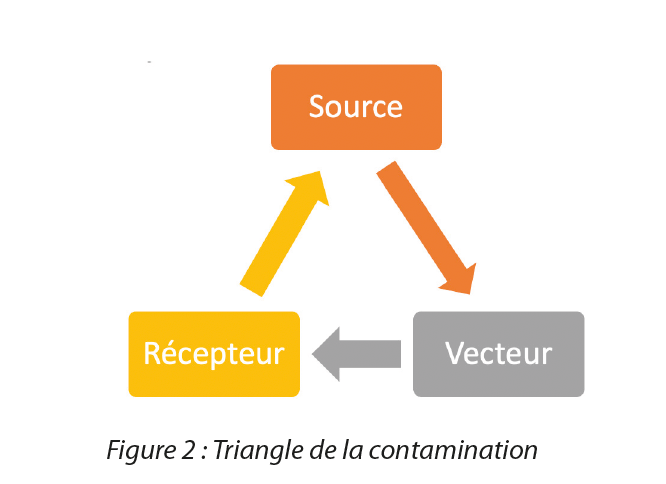
Figure 2 Contamination triangle
The DMAIC methodology has the advantage of listing all the failure modes for a particular stage, but its main disadvantage is that it underestimates the risk for a given flow and accumulation of stages. It is during the “define” phase that the SIPOC (Supplier, Input, Process, Output and Customer) method can be inserted. Before presenting the integration of the SIPOC approach into the DMAIC process, let’s take a moment to understand this new system.
The SIPOC (Supplier, Input, Process, Output and Customer) methodology is used to map the critical flows and parameters influencing product quality at each stage. The SIPOC process will assess the risk inherent in each subcontractor involved in the flow. SIPOC can be defined as follows:
- Supplier: To define the quality, technical and regulatory requirements, through the Marketing Authorisation dossier, GxP and other regulatory/industry standard obligations. It also analyses the contracts, Contracts of Construction Duration (CDCs) and technical agreements between the customer and the carrier. This stage defines the parameters that have an impact on product quality, and which are therefore critical and need to be controlled during transport (temperature, humidity, vibration, container tightness, precise handling of cartons, etc.)
- Input: To analyse the inputs and the links between each sub-stage of the flow.
- Process: Enables flows to be accurately mapped using a flow chart, and risk stages to be identified using a multi-factor analysis grid. This analysis grid should indicate the level of control for each parameter identified as critical at the “supplier” stage. For each critical parameter, the existing means of prevention must be compared.
- Output: This stage defines the outputs of the process.
- Customer: This stage defines the customers of the process, i.e. the people who receive the outputs, results and benefits of the process.
This methodology can be applied in its entirety. However, as this would be cumbersome and redundant with the DMAIC methodology, it is more appropriate to use it on a more limited basis. This involves:
- Identifying the quality, technical, organisational and regulatory requirements of the product being transported and the flow. This will identify the critical parameters to be controlled during transport.
- Mapping the flows using a flow chart, highlighting:
- The links between each sub-stage and all the modes of transport, storage, loading, unloading and handling at each stage.
- The number of subcontractors involved in each stage (for a transport stage, several companies may be involved).
- The level of control of each critical parameter (controlled or simply monitored temperature, transporter audited, intense and non-measurable vibration level, etc.)
- Qualifications and validations, as well as checks carried out (sterility test, resistance test on packaging items, etc.)
- Drawing up a multi-factor analysis table defining the level of control for each sub-contractor involved in the flow.
- Rating the level of control, i.e. estimating the level of risk for each stage of the flow and each subcontractor/carrier involved in the flow.
As you can see, SIPOC does not detail every risk for the product. It provides an overall estimate of the level of control for a subcontractor and a stage in the supply chain. This estimate can then be cross-referenced with the assessment of each risk, carried out using the DMAIC methodology.
SIPOC enables precise mapping of flows by identifying inputs, outputs, requirements and constraints of each flow, and the critical parameters that have a positive or negative influence on the process under study, while making the link with the quality (Good Manufacturing Practice (GMP), Good Distribution Practice (GDP),ISO standards) and technical requirements of the Marketing Authorisation dossier.
In simple terms, the SIPOC tool is used to rate transporter risk. It is perfectly suited to understanding flows. This approach does not provide details, but it does provide decision makers with relevant information, as well asoffering an overall view of a process and a flow. Based on a grid of precise analysis parameters and flow mapping, this approach will summarise the critical risk control parameters for each flow and carrier. By targeting the critical stages or carriers, the tool ultimately enables you to improve your process. When quantifying the performance of the transport and the people involved, we should include a study of the history (audits, complaints, anomalies, pharmacovigilance, etc.)
3. The DMAIC / SIPOC analysis approach
Now, lets look at the approach and logic for using DMAIC / SIPOC to analyse the risks of a fictitious pharmaceutical product. This approach can, of course, be adapted to your specific transport conditions.
Figure 3: The foundations of your analysis
| Define | |||||
| The scope | The objectives | The team | Workflows and processes | Product specifications | Failure and contamination scenarios |
| Specify which flows, carriers and storage stages are included in this analysis | Define the scope of the risks to be controlled (sterility, degradation of the container, loss of integrity, creation of impurities, loss of seal on the sterility barrier, etc.) using release and stability tests, the Marketing Authorisation dossier and the regulatory requirements. | A multi-disciplinary team of experts and representatives from the various departments affected by this analysis. | The SIPOC method: mapping your flows using a flow-chart. This summary map should also show the critical control parameters (time, temperature, handling, monitored or unmonitored premises, etc.) | In line with the objectives of this risk analysis. The aim is to maintain and control the product specifications given in the Marketing Authorisation dossier. | Contamination triangle and 6M tool and history of existing validations and checks carried out on the product at each stage of the flow. |
The framework of the analysis and the description of your flows are important steps. You need to know how to break down your process into different sub-stages by mode of transport, by carrier or by phase, for example, warehouse storage A followed by truck transport then handling for warehouse storage B.
For each of these sub-stages, you need to identify the relevant control parameters. Here are a few examples: timings, environmental conditions (temperature, humidity, cleanliness, room monitoring, etc.), types of transport (lorry, plane, etc.), product storage conditions (packaging, palletisation, protective foam, anti-vibration or anti-shock system, etc.), vibration conditions, shocks and acceleration and pressure variations.
The mapping of your flows should define the conditions to which your product is subjected and the level of compliance of subcontractors with good practice regulations (GxP).
- Storage/transport conditions in terms of temperature, duration, vibration, handling, etc.
- Carriers and intermediaries: contract, technical agreement, specifications, audit and anomaly history, training, etc.
- Parameters and conditions monitored, released, validated, etc.
- Checks carried out on the product before, during and after the stage under study
- Existing quality documentation
This will enable you to build your flow-chart of the process studied and to construct a summary table outlining the general control of your carriers at each sub-stage (Figure 4).
Figure 4: Example SIPOC multi-factor analysis grid
| Stage | T°/ HR | Holding time | Risk of failure to meet deadline | Classified premises? | Change in pressure? | Shock and vibration | Stock – Dedicated transport? | Fixed itinerary? |
| Truck transport by subcontractor B | Controlled and monitored temperature (ambient) T° given free | 30 days Validated | No | No | No | Yes | Yes | Yes |
| Storage at subcontractor’s C | Not controlled and not monitored | 30 days Validated | No | No | No | No | No | N/A |
| Subcontractor air transport D | Not controlled, not monitored | 60 days Not validated | Yes (customs block) | No | Yes | Yes | No | No |
| Stage | Multiple handling? | Storekeeper and transporter audited ? | CDC Contract of Construction Duration – Contract | Training GDP GMP | Pest control | Background | Stage under control | |
| Storage at subcontractor C | No | Yes | Yes | Yes | No | Anomaly XXX: handling error resulting in an overturned pallet | Strong | |
| Subcontractor air transport D | No | Yes | Yes | Yes | Yes | N/A | Medium | |
| Storage at subcontractor C | Yes | No | No | No | No | Anomaly XXX: loss of document | Low | |
This example illustrates the generality of the SIPOC methodology, which enables a general risk to be rated for a process, without indicating any specific risk. The stages targeted with an average or low level of control will have to be the subject of a remediation plan. To be able to estimate this level of control, a rating rationale must first be constructed (Figure 5).
Figure 5: Example SIPOC flow rating rationale
But stopping at this general analysis is not enough. We now need to target all the failures in each process, along with their causes, occurrences, and severity.
4. Failure scenarios
For each stage, we need to imagine all the scenarios that could cause a failure in the product being transported. To do this, you will need to use the 6M framework and the contamination triangle. The 6M approach will enable a systematic study of all conceivable failures, for each identified risk area (Figure 6).
Figure 6: Example risk and potential causes of sterility loss
| Risk and potential causes of sterility loss | |
| Workforce |
|
| Material |
|
| Equipment |
|
| Environment |
|
| Method |
|
| Measure |
|
For contamination risks (microbiological, particulate or cross contamination), the 6M approach should be used in conjunction with knowledge of the contamination triangle and the transfer routes for this contamination in order to list all the sources and vectors of contamination.
A source is an element with the potential to generate contamination. The following are examples to be taken into account:
- Number of people, level of dressing, level of training
- Type of handling on and around the product, and complexity of handling
- Packaging and protection of the product from the environment and transport conditions
- The direct environment in which the product is stored.
A vector is an element that transfers or promotes transfer from the source to the receiver. Examples of elements to be taken into account are:
- Flows
- The duration of each stage
- Modes of transport and storage. Certain methods can generate vibratory or mechanical stresses, shocks, altering the product, its packaging or its watertightness.
Using these two systems, a summary table of all potential failures, probable causes and sources/vectors of contamination can be drawn up. In this table, a column will also describe the existing control elements for each failure (Figure 7).
Figure 7: Example of existing control elements for each fault
| Malfunctions | Probable causes | Existing control elements |
| Incorrect direction of transport leading to leakage or alteration of the product |
|
|
The difficulty in this exercise is to be exhaustive! Listing all the faults and visualising the probable causes of these faults is an arduous task, even if the 6M tools and knowledge of the contamination triangle and its transfer routes are there to guide us. This analysis must be carried out by a panel of experts. The make-up of your multidisciplinary team and the expertise of its members will be key to the success of your project. You can ask an external consultant to coordinate the project, but the active participation of people within your organisation is essential. They will bring a shared knowledge of your company and the specific features of your product. This is the most difficult part of the analysis: identifying all failures.
Once you’ve built your table, you need to move on to risk assessment:
M for Risk Measurement
This is where you will use the FMECA methodology (Failure Mode and Effect Critical Analysis). For each failure risk scenario identified, a risk assessment will be carried out using the PNR rating (Priority Number of Risk). It will be necessary to estimate:
- The frequency: the probability of the event occurring. Estimating an occurrence is also a difficult exercise. Your analysis can be supported by historical data (deviations from this failure). Existing preventive measures will also help to determine the frequency. What qualified or validated elements exist? What is the level of the QA system in-house and at my subcontractors to prevent this fault? The SIPOC analysis will also help you to estimate the frequency of occurrence, as you now know the level of control at each stage of your flow.
- The severity of the fault
- The existing detectability of this event
As you know, the PNR rating is calculated by multiplying the criticality (Severity x Frequency score) by the detectability. It is important that the value of each criterion is defined and it is therefore product / flow dependent.
Figure 8: Example severity scores
| Score of 1 | No impact on the patient, the product or its packaging |
| Score of 2 | Impact on product efficacy with no risk to the patient or impact on traceability and appearance of packaging |
| Score of 3 | Impact on patient (loss of sterility, particles) Or impact on product efficacy AND packaging traceability |
A for Risk Analysis
Depending on your rating, the failure will be rated at a low level of risk, i.e. acceptable, or at a high level, i.e. unacceptable, with the obligation to implement actions to reduce the risk. The discussion often centres on the average rating level; depending on the circumstances, the risk may or may not be acceptable. This is where your first SIPOC analysis comes in. The average FMECA risk levels must be corrected for stages and subcontractors that have been assessed as having a medium or low level of control in the SIPOC analysis.
I for Improve
Following your rating, risk control measures must now be defined. These risk reduction measures may be technical or organisational to reduce occurrence, or detectability or quality control actions to improve detection of a failure. It is up to your team of experts to put actions that are sufficient and proportionate to your level of risk in place. Make sure, however, that the proposed measures are effective and do not generate new risks.
C for Risk Control and Communication
Then it is up to you to bring your risk analysis to life. We’re talking about risk management, because you’ll need to define a frequency for reassessment: in the event of a change in the flow or in one of the analysis items, but also periodically, in the absence of change. Risks reassessed in this way will be used to determine the residual risk, and actions will be updated.
The assessed risks will also be communicated to internal and external decision-makers. Another difficulty is explaining and applying the risk reduction actions to your subcontractors. Putting the right actions in place and checking that they are being applied correctly is another challenge.
5. Conclusion
The scope of risk assessment concerning your manufacturing process must now encompass your suppliers and supply chain. Outsourcing to suppliers presents a major challenge for manufacturers, as control of supply companies (providing consumables, raw materials, packaging items, and excipients) or service providers (maintenance subcontractors, analytical subcontractors, training, or cleanroom qualification subcontractors, etc.) are potential sources of risk.
New regulatory requirements, particularly the EU GMP Annex 1, reinforce the obligation to manage, control and monitor these risks, prompting the prioritisation of quality system development in response to these obligations.
As part of enhancing risk management practices, critical activities outsourced by pharmaceutical companies, including distribution and transport, should be thoroughly evaluated using appropriate quality tools tailored to the specific requirements of the transport chain. This article introduces key risk assessment tools to aid in evaluating your supply chain and which can be integrated into a global strategy for validating your transport.
Share


References
1.BPF part I 3.6 et 5.17 et 5.18 et 5.20 / 5.21 et 5.25 à 5.29 et 5.30 5.35 à 5.36
2. Annexe 1 BPF
3.EU Guidelines for GMP for Medicinal Products for Human and Veterinary Use, Part 1 Chapter 5: Production (BPF part 1 chap 5)
4.Articles 27 à 30 : Starting material (Qualification of suppliers, supply chain traceability)
5.ICH Q 9
