Sommaire
- Validation Strategy of Viral Decontamination Methods, a quick overview
- Antibody-Drug conjugate Manufacturing Techniques
- Robust and Convenient Single-use Processing
- Cahier Pratique – Quality by design applied to viral safety of Biologicals: Case studies & workshop discussion summary
- Mass spectrometry as a powerful tool for the characterisation of monoclonal antibodies in the context of comparability studies
- Chromatographie Continue : Solution d’amélioration des performances de procédés et « debottlenecking » des capacités de Bioproduction
- Protein A Affinity Chromatography for Efficient Fab Purification
- Enabling Higher Post Protein A Product Purity Using Novel Chromatographic Clarification Approach
Fabs, or fragments of antibodies with antigen binding, offer several advantages over monoclonal antibodies (mAbs) including binding to inaccessible epitopes, tissue and tumor penetration, and improved manufacturability.

While the purification of these molecules can be achieved through the use of custom affinity resins, separate resin types are often required for different subclasses of Fab molecules. A more widespread approach could be the implementation of generic,commercially available Protein A affinity resins for Fab purification. Protein A resins are often used in antibody purification to take advantage of the strong interaction between staphylococcal Protein A and the Fc region of IgG. Staphylococcal Protein A can also specifically interact with Fab derived from the VH3 family (Bouvet, 1994; Roben et al., 1995). By leveraging these types of interactions, Fabs may be purified using affinity chromatography resins in a way that is applicable to a wide range of molecules.
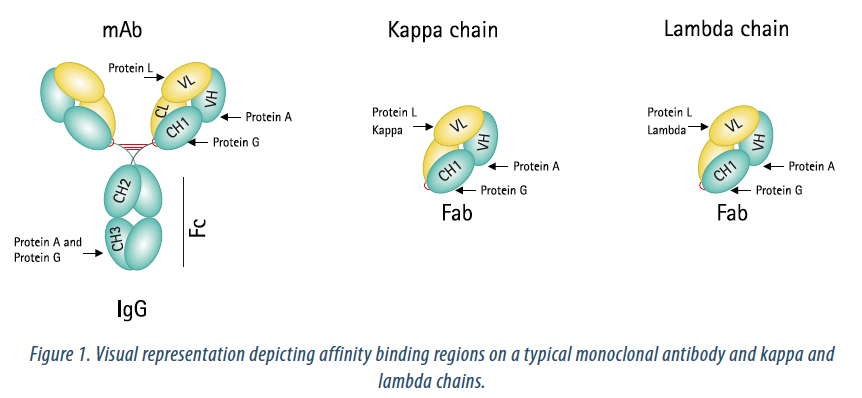
In this study, a variety of commercially available affinity resins were evaluated for binding to two Fab molecules. A description of the resins is provided in Table 1. Figure 1 depicts the affinity binding regions on a typical monoclonal antibody, along with kappa and lambda chains. Fab (lambda) binding agarose was used as a negative control since both Fabs used in these studies were based on kappa binding domains.
| Resin | Molecule | Base Matrix | Fab Binding |
| Protein A based agarose resin | Protein A | Cross-linked agarose | VH3 |
| ProSep® Ultra Plus resin | Protein A | Controlled pore glass | VH3 |
| ProSep®-vA Ultra resin | Protein A | Controlled pore glass | VH3 |
| Protein L based agarose resin | Protein L | Cross-linked agarose | VL |
| Fab (kappa) binding agarose resin | Recombinant protein (Mr 13,000) | Cross-linked agarose | Kappa light chain |
| Fab (lambda) binding agarose resin | Recombinant protein (Mr 13,000) | Cross-linked agarose | Lambda light chain |
Table 1. Description of affinity resins used in Fab binding evaluation.
Methods
A purification method was developed for evaluating the dynamic binding capacity (DBC), yield, and purity of the affinity resins described in the introduction. Two Fab feeds were used in these studies. A “Fab01” feed was an Escherichia coli extract and had a titer of 0.7 mg/mL. A “Fab05” feed was purchased from a commercial source (Wacker ESETEC®) and consisted of a Fab molecule expressed in E. coli. The titer of Fab05 was 0.8 mg/mL.
The purification method consisted of standard chromatography steps and common buffer systems described below. Each resin was loaded to 15 mg/mL except for Fab (kappa) binding agarose, which was loaded to 30 mg/mL. Fractions were collected during the loading phase for each resin and analyzed for Fab content in order to determine the DBC values.
| Step | Number of column volumes | Residence Time (min) | Buffer |
| Equilibration | 5 | 3 | PBS, 5 mM EDTA, pH 7.2 |
| Load | Load to 15 mg/mL (30 mg/mL for Fab (kappa) binding agarose) | 3.7 min for Fab01; 3.0 min for Fab05 | Feed; 0.22 μm filtered |
| Wash | 5 | 3 | PBS, 5 mM EDTA, pH 7.2 |
| Elution | 8 | 3 | 0.1 M citric acid, pH 3.0 |
| Re-Equilibration | 5 | 3 | PBS, 5 mM EDTA, pH 7.2 |
Table 2. Experimental method details.
After determining the DBC of each resin, a second set of experiments was carried out to achieve target loading values and determine the resulting yield and purity. The target loading was 85% of 5% breakthrough. The equilibration, wash, elution, and re-equilibration steps were identical to those described above for the DBC experiments.
The resulting elution pools were collected and analyzed for yield (amount of Fab recovered in elution pool vs. amount of Fab loaded), DNA (PicoGreen® and OliGreen®), HCP (E. coli HCP ELISA), Endotoxin (LAL test), aggregate, monomer, fragment content (size exclusion chromatography HPLC, MS), and SDS-PAGE to confirm breakthrough and purity.
Results
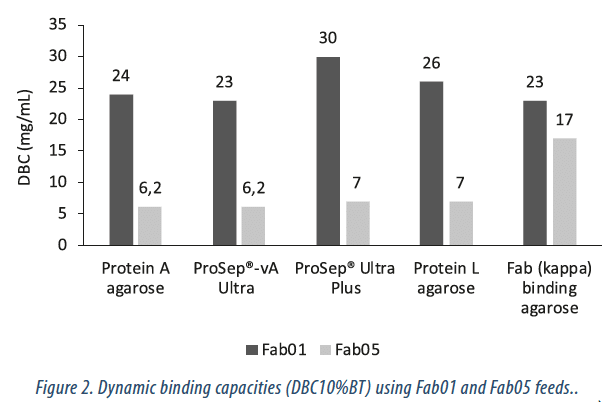
The dynamic binding capacity of each resin was evaluated as described in the Methods section. The results are reported in Figure 2. ProSep® Ultra Plus resin exhibited the highest Fab binding capacity at 30 mg/mL for Fab01. For all resins, the DBC for Fab01 was greater than that of Fab05.
This is likely due to that fact that the Fab05 feed contained a greater amount of impurities which competed for binding sites and reduced the effective binding capacity of the resins. Negligible binding was observed to the Fab (lambda) agarose negative control (data not shown).
SDS-PAGE was used to visualize the Fab breakthrough and to check the purity of the resulting elution pools. Samples of the gels are shown in Figure 3. The band corresponding to the molecular weight of the Fab increased in intensity during the flow-through fractions, corresponding to the breakthrough of the Fab. The elution samples showed significant improvement in product purity as compared to the feed. The elution samples from ProSep® Ultra Plus resin and the Protein L based agarose resin appeared to be comparable based on the SDS-PAGE results.
| Resin | Yield (%) | dsDNA (μg/mg) | ssDNA (μg/mg) | DNA LRV | HCP (μg/mg) | HCP LRV | Endotoxin (EU/mg) | Endotoxin LRV |
| Feed | N/A | 322 | 6486 | N/A | 5485 | N/A | 6,222,736 | N/A |
| Protein A agarose | 99 | 0,027 | 0,44 | 4,2 | 15,2 | 2,6 | 1690 | 3,6 |
| ProSep®-vA Ultra | 97 | 0,013 | 0,12 | 4,7 | 14,7 | 2,6 | 790 | 3,9 |
| ProSep® Ultra Plus | 94 | 0,014 | 0,15 | 4,6 | 17,8 | 2,5 | 1726 | 3,6 |
| Protein L agarose | 94 | 0,023 | 0,33 | 4,3 | 12,8 | 2,6 | 218 | 4,5 |
| Fab (kappa) binding agarose | 89 | 0,033 | 0,44 | 4,2 | 12,0 | 2,7 | 643 | 4,0 |
Table 3. Yield and purity data from Fab01 experiments.
| Resin | Yield (%) | dsDNA (μg/mg) | HCP (μg/mg) | HCP LRV | Endotoxin (EU/mg) | Endo-toxin LRV | Aggregate (%) | Fragment (%) |
| Feed | N/A | 30,2 | 1958 | N/A | 469,930 | N/A | N/A | N/A |
| Protein A agarose | 85 | < LOD | 0,84 | 3,4 | 655 | 2,9 | 1,2 | 1,6 |
| ProSep®-vA Ultra | 85 | < LOD | 0,86 | 3,4 | 241 | 3,3 | 1,0 | 1,4 |
| ProSep® Ultra Plus | 79 | < LOD | 0,65 | 3,5 | 279 | 3,2 | 1,2 | 1,4 |
| Protein L agarose | 73 | < LOD | 0,54 | 3,6 | 400 | 3,1 | 4,1 | 1,8 |
| Fab (kappa) binding agarose | >99 | < LOD | 0,29 | 3,8 | 205 | 3,4 | 3,3 | 1,6 |
Table 4. Yield and purity data from Fab05 experiments.
The yield and purity data from Fab01 and Fab05 feeds are shown in Tables 3 and 4, respectively. The affinity purification processes were found to be highly efficient. The yields were greater than 70 percent in all cases, with many values greater than 90 percent.
The DNA clearance was excellent for all resins, with values lower than the limit of detection (LOD) for the purified Fab05 material from all of the resins. HCP was reduced by greater than 2.5 LRV in all cases, with some resins achieving greater than 3.5 LRV for Fab05. Endotoxin levels were also reduced significantly for both Fab feeds and all resins.
Summary
Fabs offer some advantages over mAbs including binding to inaccessible epitopes, tissue and tumor penetration, and improved manufacturability. The interaction between Protein A and the VH3 region of Fabs provides an efficient and widely applicable means of purifying Fab molecules. The purification of two Fab molecules from E. coli feedstreams has been demonstrated using a variety of affinity resins. Like mAb purification using Protein A chromatography, the Fab purification process with Protein A resins was found to be highly efficient with significant HCP (> 3.5 log), DNA (not detectable in final product), and endotoxin clearance (> 3 log).
The use of Protein A resins is particularly desirable because these resins have already been widely adopted in many processes and have robust packing, purification, and storage protocols as well as established Protein A ELISA assay possibilities.

Melissa HOLSTEIN – MERCK

Andreas STEIN – MERCK
Partager l’article
Glossary
DBC: Dynamic Binding Capacity
HCP: Host Cell Protein
IgG: Immunoglobulin G
LRV: Log Reduction Value
mAb: Monoclonal Antibody
LOD: Limit of detection
References
– Bouvet J.-P. (1994) Immunoglobulin Fab fragment-binding proteins. Int. J. Immunopharmac. 16:419-424.
– Roben P.W., et al. (1995) VH3 family antibodies bind domain D of staphylococcal Protein A. J. Immunol. 154 (12) 6437-6445.


