


Summary
- Some good validation practices for analytical procedures
- ALCOA …with an A for Accuracy
- Established Conditions for Analytical Procedures and QbD: current situation and future perspectives for enhanced change management paradigm
- When the vibrations of molecules make their assay possible: near infrared spectroscopy in action
- Input from accelerated predictive stability (APS) studies to pharmaceutical development
- Implementation of green analytical chemistry in the quality control laboratory of the company UPSA
- Evaporation of alcoholic solutions. What residues are left on equipment?
When the vibrations of molecules make their assay possible: near infrared spectroscopy in action
It is fundamentally obvious to all of us that we can acquire knowledge about the world that surrounds us by visual observation, as long as it is in the light! It becomes much less obvious, however, if we are told that it is possible to “see” molecules by casting light on them, as everyone knows that it is impossible to see such small objects in this way. And yet…

This is what this article proposes to illustrate, capitalizing on the fact that the world around us, and the atoms which make up its molecules, form a world in perpetual motion. Atoms are connected to each other by chemical bonds set in motion by vibratory movements of very low amplitude but very high frequency (1014 Hz). And as light also possesses this vibratory nature, light and molecules have the capacity to interact, to resonate. The physicians who developed vibrational spectroscopy methods (mIR, nIR, Raman) which measure, collect and interpret these information-bearing signals, understood this very well. This article will focus on one of them, near infrared spectroscopy (nIR), which is less familiar than mid-infrared spectroscopy (commonly called infrared) as it requires more effort to interpret the origin of the signals. In mIR spectroscopy, the signals measured originate from fundamental vibrational modes, they are mostly intense and fine, and it is usually enough to refer to a database to identify the bonds responsible for the spectra obtained.
In niR spectroscopy the signals observed are non-specific. The reason for this is that they originate from chemical bonds common to all organic molecules: CH, OH, NH and SH bonds. What is captured by the nIR spectrophotometer is a sequence of mixtures arising from the molecular diversity of the sample observed (the CH bonds of all molecules for example), on which are superimposed mixtures of the vibrational modes themselves (stretching, twisting, rotation, shearing, etc.) and of their harmonics. Although an nIR spectrum is a complex object to use, its complexity harbors real riches in return, as it can deliver two types of message: firstly information about the chemical nature of the sample, and secondly about its physical state. We do need to be capable of extracting this information, however, and it is here that the use of nIR stands apart from that the mIR that is used in all analytical laboratories. In nIR spectroscopy, signals must necessarily be processed beforehand to extract the relevant information contained in these mixtures. Chemometrics, a composite discipline of mathematics, statistics and informatics, able to develop processing algorithms for complex signals to extract useful information from them, is therefore an essential companion when using nIR spectroscopy. This requirement is certainly one reason for its lesser appeal among analysts. Involving ourselves with decoding the vibrations of chemical bonds via nIR spectroscopy opens up an amazing universe as it allows not only identification of the chemical nature of products in a sample, for example the active principle and the excipients in a tablet, but also provides information on their physical state, for example the amorphous state or crystalline form of the active principle (sometimes vital for intellectual property) or its provenance (on which site this tablet was manufactured). This is why this analytical tool, although more demanding in its use, is greatly valued by those seeking to find out more. And as light travels fast, as it just touches the samples without changing them, it is also greatly valued for this rapidity in delivering information about samples as they are.
To attain this analytical performance, one step remains to be taken: that of determining the link between the spectral position and proportion of the intensity of the signals that are measured, and the property under investigation. If we wish to assay a compound within its environment, its identity should be verified beforehand. Attributing signals to a given species is a classification operation that can be conducted using specialized algorithms.
If we can obtain access in this way, from a spectrum measured on an unaltered sample, without needing to subject it to any preparation process (dissolution for example) prior to measurement, it then becomes completely feasible to take the analysis further, to determine how many milligrams of active principle (for example) are contained in this tablet. And to do so at the speed of light (or almost). We will take a look at this quantitative aspect in the rest of this article. Although the applications presented are based on experience acquired in the pharmaceutical industry, they are of course applicable to the chemical, cosmetic and agri-food industries. If the applications presented highlight the focus on solid matter (powders, tablets) we are capitalizing on a specific property of nIR radiation. While it is poorly absorbed by the material, it can penetrate it sufficiently to explore a considerable thickness, of a tablet for example, which provides access to several types of qualitative applications (identification, imaging) and quantitative applications that are very different from conventional techniques.
1. Measuring water in a flask of powder
As all powders are derived from a drying process, measuring residual water is a common operation in analytical laboratories to determine the status of the powder, whether newly produced or at the end of stability studies intended to specify the hygroscopicity of this type of powder. Two techniques are commonly used for this purpose, Karl Fischer Titration and coulometry. Both require an execution period of more than ten minutes. While placing a vial on a spectrophotometer and obtaining information in a few seconds, without having to take a sample or weigh anything, is efficient and convenient.
It is necessary to calibrate the system, by selecting the water bands in the nIR spectrum and associating the signals selected in an appropriate manner with a range of samples containing increasing quantities of water, quantities measured precisely by a reference technique. Calibration is a classic and completely essential step in analytical chemistry.
As a result, the analyst or a non-specialist technician will simply have to place a flask of powder on the nIR analyzer, wait for ten seconds and see the water content of their sample appear on the screen or on a ticket.
If we exclude the time dedicated to method development, the measurement performance is almost unrivaled among the conventional techniques. Some laboratories have replaced several Karl Fischer devices with one nIR spectrophotometer.
2. Measuring the active principle in a tablet
This is another commonplace operation in development and pharmaceutical production.
The procedure for developing the analytical tool,(1,2,3) nIR spectroscopy in this case, follows the same process: firstly the bands or the part(s) of the nIR spectrum likely to contain the information relating to the active principle in these tablets should be selected. Then a series of control tablets is prepared, containing increasing quantities of the active principle to be assayed, and the spectra of all these samples are acquired before determining their content individually using a reference method (often high performance liquid chromatography, HPLC, for solid forms) and a suitable model constructed associating the nIR signals with increasing active principle content. The whole procedure is more time-consuming than conventional methods as it requires that particular attention be paid to sampling.
The vast majority of assay techniques used in laboratories (HPLC, UV-Visible spectroscopy) operate on samples in solution, which excludes all information on the original solid state. In nIR spectroscopy, and on solid samples, as the signals carry two types of information, chemical nature and solid state, the analyst responsible for modelling a correlation must think of possible interference between these sources if they want to obtain a robust model. The complex signals that are collected, which may vary in response to diverse contributions, are preprocessed mathematically to sort and select them, but on condition of having met with samples containing these plausible variabilities. It will therefore be necessary to incorporate, in the validation steps, samples with the nominal value manufactured for example at different periods of the year to include small variations in production line settings, small variations in batches of raw materials, indeed in different equipment or operators, all things liable to interfere in one way or another and to affect the robustness of the quantitative prediction.
In the field of modelling, it is customary to speak of model and of prediction.
This is not done for conventional assay techniques for solutions, almost all of which require calibration (therefore a model), but as the processing algorithm is linearity, the simplest univariate algorithm, sensitive mainly to the precision of weighing and volumes, it is not thought of as such.
These considerations thus lead to the question being raised of how many samples are necessary to develop a model. Experience(2) shows that the number is not very high. To construct a model dedicated to the testing of tablet content uniformity on exiting production, a classic of the genre, only 85 tablets will have been needed to perform a calibration on a range comprising seven concentration levels between 70% and 130% of the nominal value, at a rate of five tablets per range level. To densify the model around the nominal value, samples of ten batches, derived from two years of production, at a rate of five tablets per batch, were introduced into the model. That makes fifty tablets.
The difficulty does not lie so much in the number of samples as in their quality. The sensitivity of this spectroscopy to the physical state of samples is simultaneously an opportunity and a difficulty when different controls for the nominal value must be obtained, which is the case for the calibration step. They should be prepared on equipment as similar as possible to that used in production, and this involves time and appropriate resources, just like the use of a reference method to ensure the quality of controls in HPLC. Modelling requires the testing of different algorithm “settings”, therefore different models before selecting the best, on statistical performance criteria.
Finally, the analytical performance is attractive. It takes around 300 minutes (5h) by HPLC to routinely assay ten tablets, and this also requires the destruction of the tablets assayed and consumption of solvents and reagents. It just takes 15 minutes by nIR, no solvents or reagents are required, and the tablets are intact and available if needed for another test. For the operator, the technical level is extremely simple: place the tablets on a sample feeder, launch the acquisition sequence, and recover the report from the printer. All the effort is expended by the developer. The user therefore has a simple analytical method to implement while also being more respectful of the environment, in line with the principles of corporate social responsibility (CSR).
By way of illustration, here is a comparison of an assay by nIR spectroscopy with the reference method, in this case, HPLC, of 1,000 coated tablets sampled over 3 years of production of a specialist pharmaceutical product.
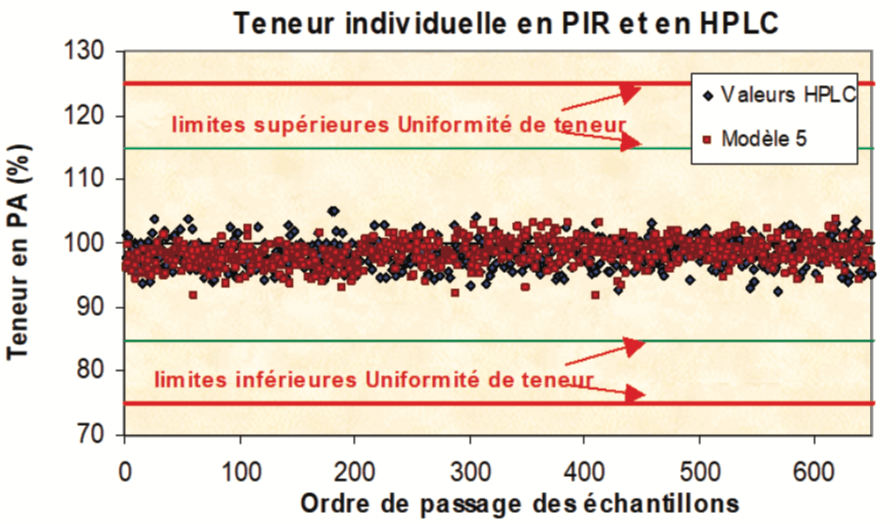
Each tablet was assayed individually in two ways: firstly by spectroscopy (non-destructive) then by the (destructive) reference method. This example also illustrates the fact that the coating of tablets does not prevent the method from probing the interior, under the coating layer.
The price of this performance defines its scope of application in practice. In the interests of accuracy, it should be specified that developing such a method requires a short amount of time (several weeks),(3) familiarization with the culture and specific expertise of nIR (spectroscopy and chemometry), and great attention to influencing factors.(3) The analyst in charge of this type of tool is able to detect a bias, a deviation but without being able to identify the cause easily. It is then necessary to conduct the enquiry to find this or that change, often made by the manufacturer without them knowing about it.
In manufacturing practice, a regular check must be made that the model has not been overtaken by changes in environment or practice. A model monitoring system should therefore be put in place with corrective maintenance sometimes being necessary.
All of this means that this quantitative approach is perfectly suited to the frequent production of large batches, with a highly stabilized manufacturing process. This is the case for some productions. On the contrary, it is not the method of choice in a formulations development environment where the ingredients change continually in quality and/or quantity from one series to another. It remains that light travels fast, is eco-responsible, and that the information it reports is worth the effort made in certain cases.
3. Measurement in real time on exiting the production line
This application presents the benefit of manufacturing and measuring at the same time, without having to wait for analyses to be returned from a control laboratory. It represents a predictable and already accessible change in laboratory analytics which is becoming process analytics, better known under its acronym PAT (process analytical technology), strongly promoted by the FDA since 2004 (5) to control the quality of a production while it is underway, rather than observing the final result without being able to correct the process trajectory. The challenge is to design sensors that are able to acquire spectra very rapidly from samples moving on a conveyor belt.(6)
This is possible in the example presented (with permission of the authors) by using several optical fibers incorporated in a probe, each collecting signals from one part of the sample surface. By diffuse reflection from within the sample, each fiber sends back information from the area it observes, with the whole forming a low resolution image.
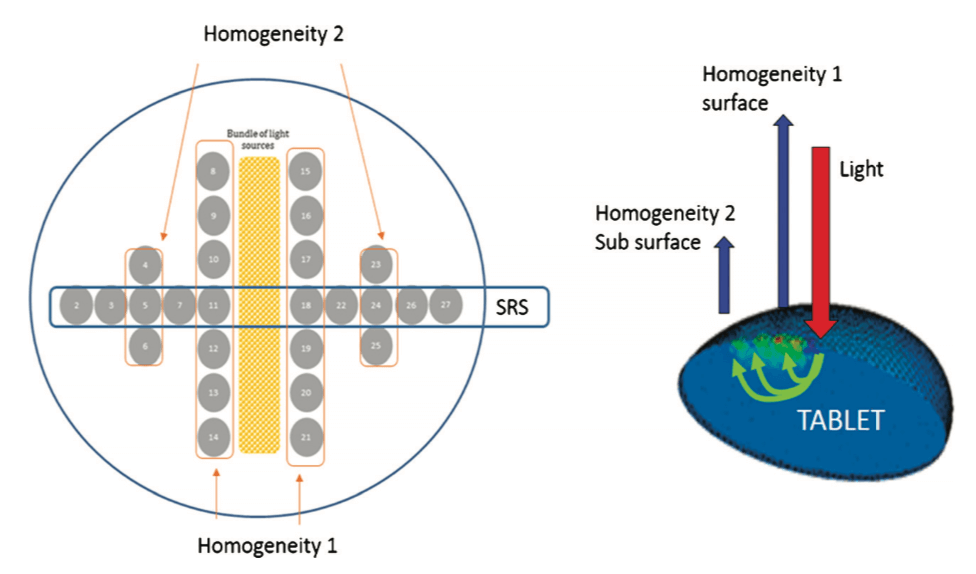
The device mentioned is able to capture 26 distinct images of a moving sample and to allow a decision to be made in under 100 msec. This rapidity of capture and processing allows out-of-specification tablets to be eliminated in real time and enables only tested compliant products to be packaged. On leaving the tableting machine, the tablets are aligned on a conveyor belt. An optical camera detects whether each tablet has the same side facing upwards; if this is not the case, an ejection device sends it back until it returns in the correct presentation. It then passes under the nIR probe which will certify its compliance (or not) before packaging. The multifiber probe can return two types of information: one, qualitative, on the homogeneity of distribution of components within each tablet, the other quantitative, the active substance content of each tablet. Only tablets compliant with specifications continue on their way to be packaged.
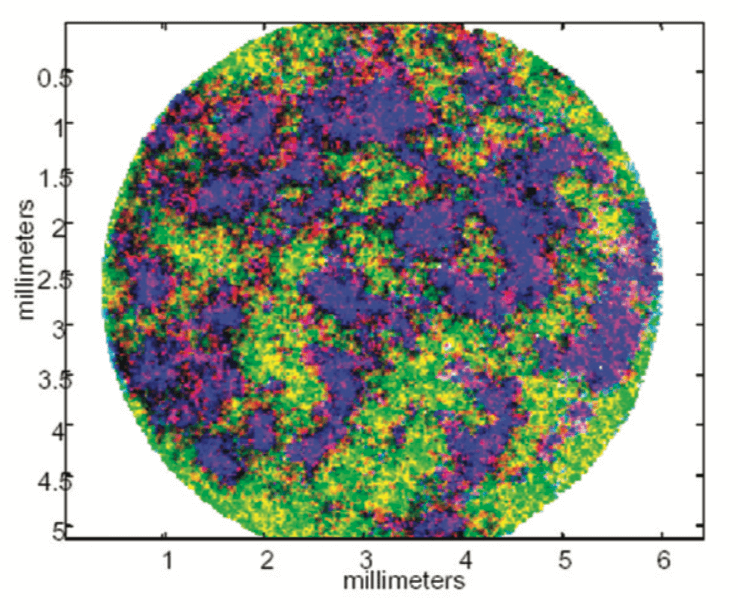
These few examples illustrate what vibrational nIR spectroscopy can already contribute, allowing the visualization and differentiation of the chemical components of a sample, whether this is in the laboratory by spectroscopy, or in a more spectacular manner through hyperspectral imaging (4) (such as this tablet, on which appear (in false colors) the active principle in red, lactose in blue and maltodextrin in green), and finally in-line by low resolution imaging in real time. The application of these tools in the right way guarantees added value.
What must also be remembered is that these high-performance tools take analytical chemistry into an area that is new for analysts who are used to employing the common panoply of control laboratory techniques. Not only should they learn to master chemometry in order to draw the maximum benefit from it, but in addition these tools will take them out of their control laboratories and into the production workshops, to become essential experts in continuous control and continuous production processes.(7) Knowing that both the FDA and the EMA, to cite only these two major agencies, have the expert capacity to receive and accept MA dossiers and variations.(8)
Share article


Yves Michel Ginot – Servier
Après un PhD en Biophysique (Paris VI), quelques années de recherche fondamentale et 3 décennies de développement analytique pour les dossiers AMM chez Servier, un passage par l’expertise à la Ph Fr, la présidence de deux commissions SFSTP sur les spectroscopies vibrationnelles, Y.M. Ginot s’intéresse aux voies d’innovation dans le contrôle continu (en temps réel) qui débouchent sur les procédés de fabrication continue. Il est également Président de Le Studium, Institut d’Etudes Avancées en Région Centre Val de Loire.
yves-michel.ginot@servier.com

Yoann Gut – Servier
Ingénieur Polytech Orléans, PhD en spectrométrie de masse et traitement du signal, Y. Gut développe le traitement du signal, l’analyse multivariée, dans les différentes applications de spectroscopies vibrationnelles, imageries hyperspectrales, et le contrôle continu de procédés de fabrication pharmaceutiques et/ou chimique au sein du Pôle d’expertise Développement Pharmaceutique de Servier à Orléans.
yoann.gut@servier.com
References
(1) Le dosage par spectroscopie proche infrarouge. Application au test de l’uniformité de teneur des comprimés. I. Méthodologie Commission SFSTP, Y.-M. Ginot P. Bernard-Moulin, R. Cinier, F. Despagne, J.P. Dubost, L. Francès, M. Le Bihan, M. Le Page, A. Michelet, L. Meunier, G. Monteillet, A. Quintana , A. Rieutord, I. Storme, F. Thevenot, E. Ziemons STP PHARMA PRATIQUES – volume 20 – N° 2 – mars-avril 2010
(2) Tablet potency of Tianeptine in coated tablets by near infrared spectroscopy: model optimization, calibration transfer and confidence intervals Journal of pharmaceutical and biomedical analysis, 54 (2011) 510 – 516 Mathieu Boiret, Loïc Meunier, Yves-Michel Ginot
(3) Le dosage par spectroscopie proche infrarouge. Application au test de l’uniformité de teneur des comprimés. II. Commission SFSTP, Y.-M. Ginot
P. Bernard-Moulin, M. Boiret, R. Cinier, F. Despagne, J.P. Dubost, L. Frances, M. Le Page, A. Michelet, L. Meunier (†), E. Ziemons
STP Pharma Pratiques – volume 24 – N° 1 – janvier-février 2014
(4) Chemical imaging: an essential contribution to assess pharmaceutical quality, STP Pharma Pratiques , mai/juin 2019 – n°03 p24-37, STP Pharma Pratiques, juillet/août 2019 – n°04, p. p38-55, Commission SFSTP, Y.-M. Ginot, F. Bonnier , F. Chauchard, Y.Gut, A. Michelet, A. Tfayli, E. Ziemons
(5) Guidance for Industry : PAT – A Framework for Innovative Pharmaceutical Development, Manufacturing, and Quality Assurance, FDA, 2004
(6) Use of near infrared spectroscopy and multipoints measurements for quality control of pharmaceutical drug products Anal Bioanal Chem, 2016, 409, 683-691, 2017 Mathieu Boiret, Fabien Chauchard,
(7) Quality Considerations for Continuous Manufacturing – Guidance for Industry, FDA , 2019
(8) Continuous manufacturing: could 2021 be year of the first biologic approval ? Pharmaceutical Technology, dec 2020
