


Summary
- Some good validation practices for analytical procedures
- ALCOA …with an A for Accuracy
- Established Conditions for Analytical Procedures and QbD: current situation and future perspectives for enhanced change management paradigm
- When the vibrations of molecules make their assay possible: near infrared spectroscopy in action
- Input from accelerated predictive stability (APS) studies to pharmaceutical development
- Implementation of green analytical chemistry in the quality control laboratory of the company UPSA
- Evaporation of alcoholic solutions. What residues are left on equipment?
Some good validation practices for analytical procedures
The aim of this article is to remind readers of some of the fundamentals of the validation of physicochemical methods applied to active principles or finished products. It will not claim to address all the specific cases with which an R&D or control laboratory may be confronted, however.
The concepts of total error will be developed in more detail in the following article (“ALCOA… with an A for Accuracy“) in this journal.

1. Introduction
The validation of an analytical procedure is a thorough evaluation of its performance (or of its potential error) and consists in verifying, determining and estimating several validation criteria (or characteristics)1 which include:
- specificity,
- response function (or standard curve) if applicable,
- trueness (referred to as “accuracy” in the text ICH Q2 (R1)),
- precision which includes repeatability and intermediate precision (reproducibility generally being evaluated in the qualification studies of several laboratories),
- the linearity of results,
- the limit of detection/ quantification in the context of quantification of impurities/
traces/degradation products,
- the working interval (range)
This validation step just confirms that the method that has been developed meets the criteria fixed by the user for the use that will be made of it routinely. It is only carried out after a complete development adapted to this same use. Before validation, it will have been necessary to:
- evaluate, understand and maximally limit the sources of variability of the analytical method (in particular through one or more robustness studies) for quantitative methods.
- ensure the specificity of the method with a forced degradation study
- pre-validate the technique to ensure that it will fully meet the acceptance criteria that will be fixed in the validation protocol (and to complete the development if that was not the case).
It is in effect pointless to validate an ill-controlled method or one which does not have a “stability indicating” capacity, if required. Analytical procedure development remains a crucial step in ensuring that the method is robust and in avoiding wasting time during validation.
Validation will therefore confirm, for the user laboratory and for the supervisory authorities, that the performance of the method is adequate for the use that will be made of the method.
It should be kept in mind that the objective of any analytical method is to demonstrate the Quality of the product analyzed, in particular in terms of efficacy (reliability of assay) and patient safety (detectability and quantification of impurities, related substances and potentially toxic degradation products).
2. Expectations of the authorities and scientific needs
It is beneficial to look over each validation criterion while keeping in mind the impact that this could have on the evaluation of product efficacy or patient safety, and taking care to comply with the expectations of the authorities: ICH Q2R1,[1] GMP,[2, 3] USP,[4] FDA Guidance.[5]
However it is rarely enough to merely “tick” the regulatory requirement boxes.
A thorough examination of the validation results is necessary so that the user adapts the surveillance of their method in line with the performance measured during validation.
Instead of saying “the method is validated, therefore my results are correct” it is thus strongly advised that we provide ourselves with guarantees that “my results are reliable, so my method is valid”.
This amounts to considering that knowledge of the method and its performance, and the surveillance of this performance, allow us to be confident at all times that the results produced by the method are (and remain) reliable. This vision of the life cycle of the method, with validation as a single step among so many others, is clearly defined in the draft USP <1220>[6] and in the FDA Guidance.[5]
The reliability of a measurement depends on the potential errors associated with this measurement.
This error can be broken down into 2 distinct parts:
- Systematic error (corresponding to “trueness”). This is defined as the deviation of the mean of several values obtained relative to the value considered true (this true value is often only an estimate, as it is rarely known exactly).
- Random error (corresponding to “precision”). It is defined as the error in each individual value, caused by the different sources of variability of the analytical procedure (which we will have tried to reduce as much as possible during development). In other words, it concerns the spread of results that we will obtain if the analysis is repeated x times.
The illustration of these 2 types of error is frequently represented in the form of targets (Figure 1):
- In the center: the true value
- Around the center, the limits (validation acceptance criteria, alert threshold, specification limits, etc.)
- In red, the measurements made
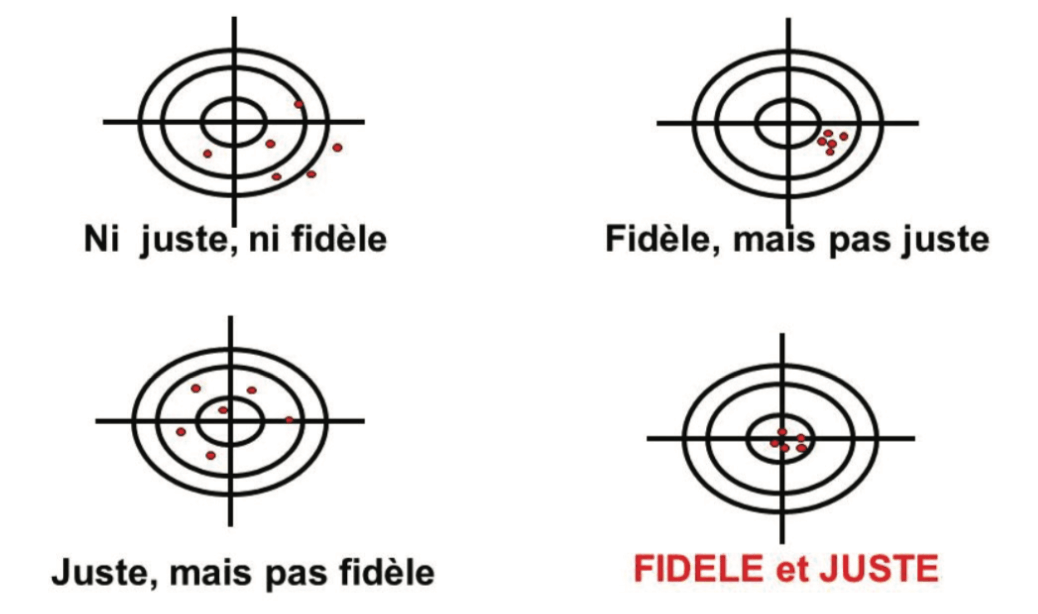
Precise and true results will be subject to a lower level of uncertainty, and will therefore be reliable. If not, we must be aware of the error associated with the measurements obtained with the method, in association with the uncertainty of each measurement. In the target in Figure 1, a red dot outside the target illustrates the “nightmare” of Quality Control laboratories = an OOS result associated with analytical variability, to which it is difficult to attribute a formal cause.
In summary, validating an analytical method comes down to demonstrating a capacity to measure, quantify, qualify, characterize in a reliable manner.
3. Identifying the sources of variability and measuring their impact
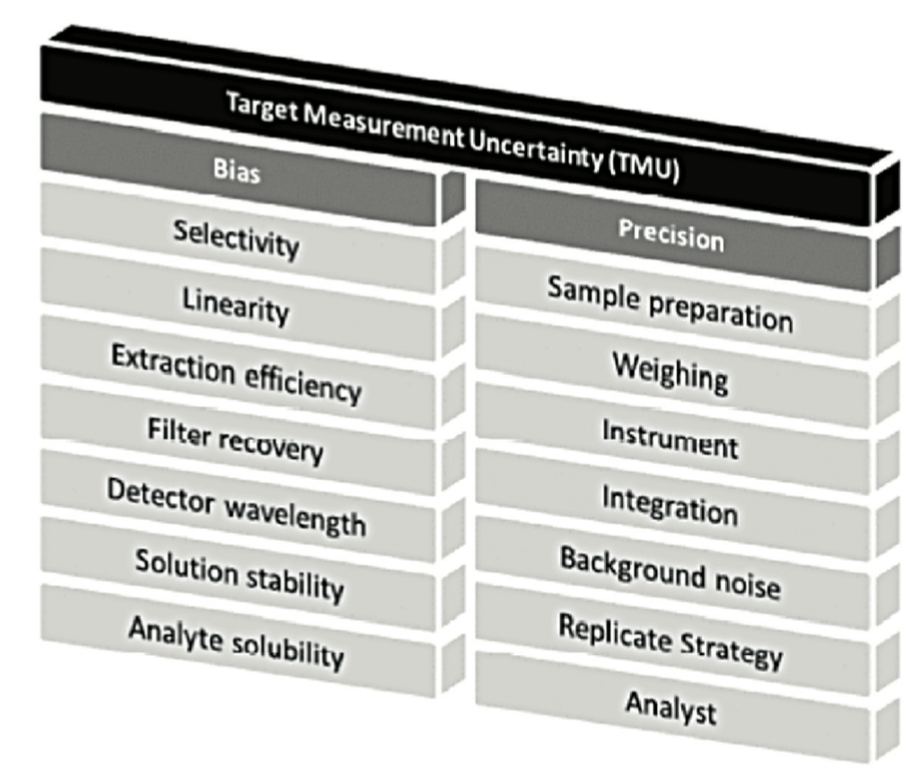
Measurement uncertainty may arise from numerous sources (Figure 2 and Figure 3). It is important to identify the sources of variability, then to optimize operational conditions to reduce their impact to the maximum extent possible when they are detected.
We can see in Figure 2, that different validation criteria described in ICHQ2(R1) are studied as they are potential sources of random or systematic errors. But finally, it is the overall impact on the uncertainty of the result that must be considered. The article on the A of ALCOA, in this journal, will clarify these concepts of total error, that are so important in achieving a better understanding of the reliability of measurements made in the laboratory.
4. Design and documentation
The analytical validation process follows development of the method and includes an experimental element and a documentation element which provides data traceability. In particular, a protocol and a report must be written and signed before and after validation respectively. The different versions of these 2 documents and the various changes made to them must be tracked.
The protocol must contain as a minimum:
- the validation criteria that will be evaluated (defined according to the aim of the method) and/or the design chosen,
- the methodology used to carry out these tests,
- the reference of the method to be validated and its version,
- and the criteria or acceptance limits of each criterion (including expectations in terms of statistical and/or graphic processing).
Reference can also be made in the protocol to development studies whose results will be reprised in the validation report (robustness and forced degradation in particular).
The report must contain as a minimum:
- The reference of the validated procedure and its version.
- If appropriate, the results of development studies that supplement validation.
- The different deviations encountered during the validation.
- The results of validation and conclusions on the performance of the method.
- The relevant raw data (results, standard chromatograms).
- And any changes to be made to the analytical procedure (supplementary information in particular).
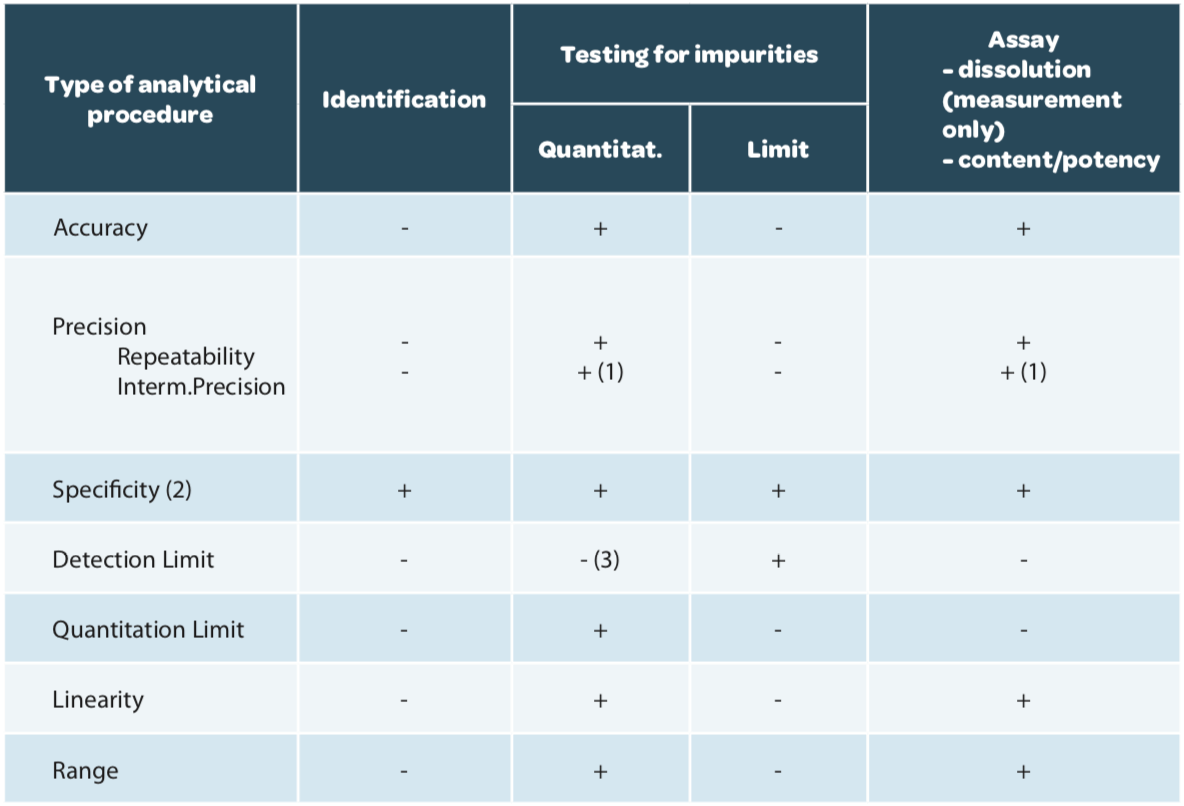
The validation design, that is the criteria to be verified, are described in ICH Q2(R1) according to the aim of the method (Table 1).

Specificity / Selectivity
The term “Specificity” is today used for both terms. However, the term “selectivity” is often used for a method that provides a response for several analytes (separation methods in particular).
The specificity of an analytical procedure is therefore its capacity to evaluate the analyte unequivocally, that is to verify that nothing is interfering with the response of the analyte (or that it is interfering in a non-significant manner).
To verify specificity, the following are analyzed as a minimum: (i) a blank, (ii) a placebo (excipient mixture without the analyte of interest), (iii) a standard and (iv) a finished product. Specific impurities can also be included if necessary. A check is then made that no significant interference is observed in the placebo.
The why and the how
The absence of interference with measurement of the analyte is evaluated in order to guarantee that the quantification will not contain an error. This error may be systematic (stable interference over time) or random (if the interfering compound may be present at variable concentrations).
It is quite possible to tolerate an interference if it is weak enough to not generate an unacceptable bias (under 1 or 2% of the signal to the target, for example), but it should be ensured that the interference is constant (that it does not vary from one production to another or that it does not change during a stability study).
If a method is not specific (titrimetric assay methods or direct UV assays), it is advisable to have another method which allows better determination of the composition of the product tested (additional tests of purity by a separation method).
Linearity (of results)
Linearity should be understood as the linearity of the analytical procedure, that is its capacity, in the assay range considered, to provide experimental content levels that are strictly proportional to the analyte content in the sample.
Linearity should not be confused with the response function (also called standard curve) which represents the analytical response according to the concentration of standard(s). It is quite possible that the response function may not be linear (for example, with an ELSD detector, for an Elisa assay) but that the results are indeed linear. This indeed is what is wanted.
To verify linearity, several concentration levels distributed throughout the assay range should be tested. The graph of sample concentration determined experimentally is then traced as a function of theoretical concentration.
The criteria for the results of linear regression can for example be to have a slope of the line close to 1 and an intercept close to 0 with a coefficient of determination greater than 0.99.
Well, the ICH Q2(R1) guide requires only a correlation coefficient criterion, a graph and the equation of the regression, and the residual sum of squares, calculated during the regression. We assure you, this last parameter is rarely required in reports as its interpretation does not bring added value to the aim of an analytical procedure validation.
The why and the how
The value of this parameter is to identify a possible effect of the matrix, if the study is carried out on a reconstituted sample. This is why there is very limited value in measuring linearity in solutions, without this study of reconstituted samples.
This linearity of results is important to guarantee the reliability of analyses and is totally linked to the study of trueness, as indicated in Figure 2.
For calibration, if the responses obtained with the method are not linear, it is then possible to determine another mathematical function (weightings, quadratic model, log/log or other transformations) to obtain linear results.
Trueness
Trueness expresses the closeness of agreement between the mean value obtained from a series of test results and a value that is accepted either as conventionally true, or as an accepted reference value (e.g.: international standard, pharmacopoeia standard, result obtained by another validated method). It involves a measurement of systematic error (bias).
It is recommended that trueness be determined with a minimum of 3 concentration levels and 3 replicates per level (9 determinations), in compliance with ICH Q2(R1) in the paragraph “Accuracy”. These results will also serve to determine linearity. For the evaluation of trueness (and of linearity), reconstituted samples should be generated in which the concentration of the analyte is known, in the same matrix as the product that will be analyzed. It is sometimes difficult to access these reconstituted products which are prepared with a process similar to that used for the finished product. Reconstituted samples produced in the laboratory can sometimes generate problems of homogeneity which lead to erroneous conclusions regarding the performance of the method.
In the context of tablets or other solid or semi-solid pharmaceutical forms, a solution consists in adding a known quantity of analyte to a combination of excipients. This route does not allow perfect replication of the mechanism of extraction of the analyte from the matrix. This extraction event may however be evaluated partially in precision studies even if approximately (by checking that the content obtained for each preparation is indeed that which was expected).
Trueness is expressed in terms of percentage recovery, that is we calculate mean recovery for each level (quantity calculated/quantity added, possibly taking account of the initial quantity if we do not have a compound without the analyte under investigation, as in the case of residual solvents).
In fact, for each determination we calculate the ratio between the content determined experimentally and the content determined theoretically. Then we determine mean recovery. The recovery at each level must fall within the acceptance criteria for trueness. Basing ourselves solely on the mean of all the levels could in effect mask the disparities between levels (it would then be necessary to limit data spread). Confidence intervals for the mean should also be provided, in compliance with ICH Q2(R1).
The why and the how
Verification of trueness is important. It checks that at each concentration level, analyte content measurements made by the analytical procedure will return a true value (or, to revert to the image of targets, if we move the target, we will continue to shoot at it and not at the place where the target was previously). The mean recovery of the replicates of each level allows detection of bias in one of the levels. It should be noted that the analysis of the linearity of the method and results should lead to the same conclusion as the study of trueness.
Depending on concentration levels, it will be possible to propose more or less wide targets. In fact, the lower the concentration, the more measurement uncertainty increases, and it is commonly accepted that acceptance criteria are expanded at the low point of the range studied.
Precision
The precision of an analytical procedure expresses the closeness of the agreement (measurement of spread) between a series of measurements obtained from several test samples of the same homogeneous sample, under the analytical procedure conditions.
It is a measurement of random error which is evaluated in accordance with several conditions:
- Repeatability
- Intermediate precision.
- Reproductibility
These conditions are represented schematically by the layers of the “variability onion” presented in Figure 3.
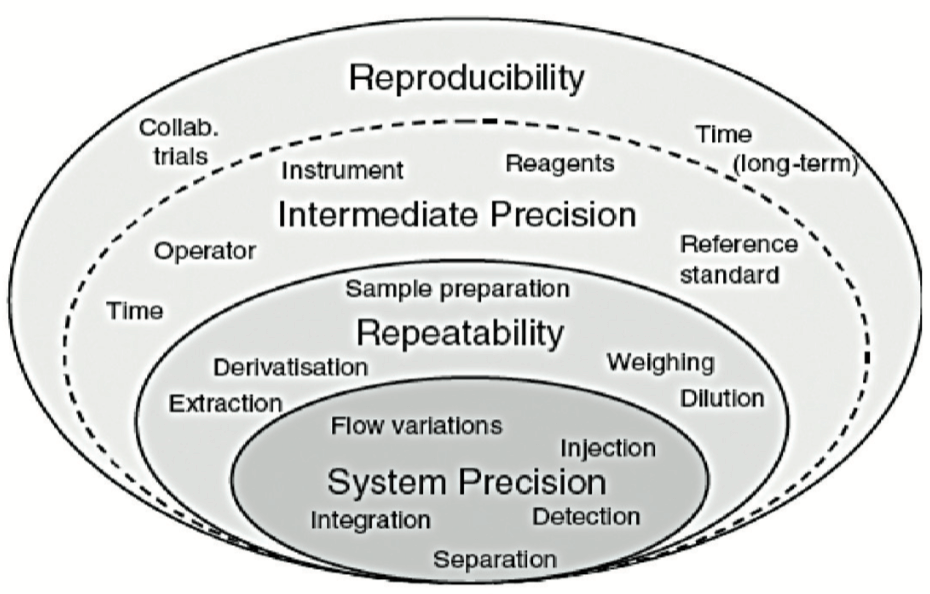
Each layer in Figure 3 is characterized by different sources of variability:
- The first layer corresponds to sources of variability in the system used. Qualification of equipment should ensure that at this level this layer is as thin as possible.
- The second layer “repeatability” contains essentially sample preparation variability.
- The third layer “Intermediate precision” includes the sources of variability existing between different calibrations, different days, instruments, different technicians, but potentially also seasonal variations, rarely assessed in validation exercises (temperature of the laboratory in summer and winter, amount of light passing through the laboratory windows etc.).
A fourth layer, generally not assessed in validation, includes inter-laboratory variability. It is generally evaluated (or experienced, if care is not taken) during analytical transfers or during covalidation by 2 laboratories.
Precision is often measured by the determination of coefficients of variation for repeatability and intermediate precision. Repeatability is evaluated (according to ICH Q2(R1) with:
- 9 determinations distributed over 3 levels and 3 replicates per level (as a minimum)
or
- 6 determinations at 100% of the validation target.
To evaluate intermediate precision, the series must be repeated taking care to change the technician and/or the system used and/or the day of measurement. A minimum of 3 series is necessary to be able to estimate inter-series variability.
The coefficients of variation for repeatability and for intermediate precision are determined via an ANOVA (analysis of variance).
To perform these calculations it is necessary to determine variances for repeatability and intermediate precision (including INTRA series and INTER series variability) then to deduce from this the coefficients of variation. Definitions are given in Table 2.

The method for determining the coefficients of variation for repeatability and intermediate precision employs the methodology presented in Table 3 for p series with n values per series.

Caution, the calculation formulas presented in Table 3 are only valid if there is the same number of repetitions per series and in the case of a design with independent preparations of the same targets.
The why and the how
The objective is to estimate the variability of the method that will be encountered routinely, during the life cycle of the method. It is not therefore wise to work “exceptionally well” during validation, with the risk of under-estimating this variability.
This would amount to minimizing the real analytical risk, as emphasized in the article “ALCOA… with an A for Accuracy” in this journal.
All too often, the CV for repeatability is calculated solely on the first series. In the method proposed, the CV is representative of all values generated. Indeed, it is important to estimate the CV for repeatability on the basis of all values (via the variances of each of the series) to obtain an estimate that is as close as possible to reality. This CV is representative of the first 2 layers of the variability onion presented in Figure 3.
Likewise, the CV for intermediate precision is sometimes calculated as the standard deviation of all values relative to the general mean (without taking account of the fact that they arise from different series). This calculation is erroneous and does not report inter-series variability, which has the consequence of minimizing the coefficient of variation for intermediate precision. This CV is representative of the first 3 layers of the variability onion presented in Figure 3.
It is therefore impossible for the CV for intermediate precision to be lower than the CV for repeatability. At best, the thickness of the third layer is minute, but it cannot in any way reduce the thickness of the second layer.
Limit of detection (LOD)/ Limit of quantification (LOQ)
The analysis of the limits of a method is essential to provide guarantees that we are indeed capable of analyzing the analyte under investigation below the acceptable limit for this impurity. For quantitative methods, it will be necessary to guarantee that we can reliably quantify all reportable results (above the reporting threshold, defined according to dose as described in the ICHQ3 series of guides). [9, 10, 11, 12]
The limit of detection is defined as the smallest amount of the analyte from a sample that can be detected. The limit of quantification is the smallest amount of analyte that can be measured accurately (combination of systematic and random errors).
Determination of the LOD is only required for limit tests, while the LOQ is determined for impurity or trace assays. Regardless of the determination method used, measurement reliability at this limit should be verified.[5]
The LOD and LOQ can be determined by several methods described in the ICH Q2 guide (R1). Everyone can choose their calculation method. These different methods do not always give the same result, but the important thing is to guarantee that the LOQ will be below or equal to the reporting threshold.
The why and the how
It is not necessarily obligatory to look for the lowest possible limit. In fact, the “Intended Use” is to report values above the “Reporting Threshold”. Validation at lower levels therefore does not provide added value. It is therefore possible to define the “Working LOQ” as being the low point of our assay range, often defined by reporting limits described in the ICH Q3 guides. Thus, this low concentration level will indeed be validated in terms of trueness and precision, as expected by the authorities.
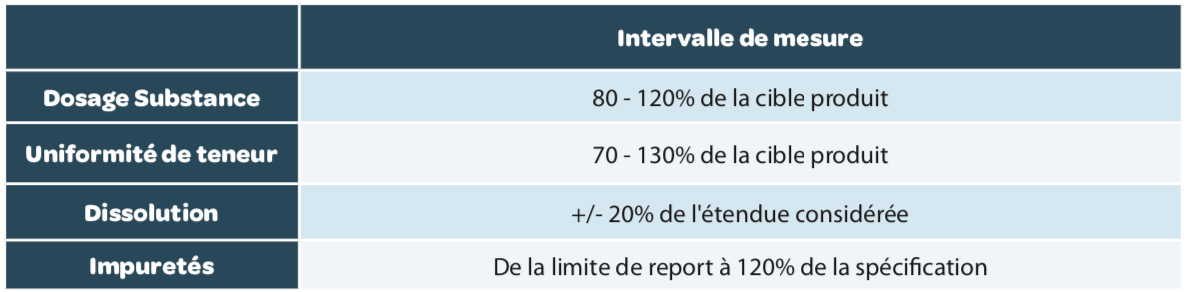
Measurement interval
The measurement interval is the interval in which the method provides an acceptable degree of linearity, trueness and precision for all measurements whose results are contained within this interval. The measurement intervals generally expected are summarized in Table 4 but can be wider if this is necessary.
Combination of systematic error and random error
Accuracy (in the ISO meaning of the term) is the parameter which includes both systematic error and random error (trueness + precision), although the concepts of trueness and accuracy are sometimes confused in some regulatory texts. It is therefore more appropriate, in the pharmaceutical field, to speak of total error (or combined error).
This is the true purpose of an analytical procedure validation, which is to guarantee the reliability of each measurement (in the individual sense) that will be obtained subsequently. Measurement uncertainty and the concept of total error are intimately linked.
Another benefit of this approach is that a potentially major problem of systematic error may be offset by a small random error and vice-versa.
These concepts of total error are described in the following article in this journal (“ALCOA… with an A for Accuracy”).
Solution stability
The stability of solutions is often included in robustness studies and is important to guarantee that the data generated remain accurate and provide knowledge of the storage period of the latter.
Stability tests must be performed on solutions:
- of standards (stock and dilute solutions in flasks and bottles).
- of samples.
- of mobile phases.
Solution stability is understood in light of the aim of the analytical procedure.
For an assay, this will involve verifying that the content determined does not vary beyond the classic analytical variability. For the investigation of impurities, it will be necessary to look carefully at chromatographic profile variations, and to check that no new impurity appears and that no impurity present in the sample disappears during the course of the analyses.
The study consists in measuring each solution considered (some laboratories repeat these solutions) with different expiry dates, and to compare this with a new reference standard. The difference relative to the initial value is then calculated, and should comply with the defined acceptance criteria. These criteria are to be defined in accordance with those defined for trueness and precision.
We can cite another practice, for separation methods, that consists in tracking the area of peaks for the same solution at regular intervals. The absence of a significant change in area is another way of guaranteeing that measurement reliability does not change with the age of the solutions analyzed. This will only be possible if the study is performed continuously, without breaks in the acquisition system, in order to compare comparable values.
Acceptance criteria/limits
The acceptance criteria/limits of analytical procedure validation are to be defined in accordance with several criteria, in particular:
- The field of application (pharmaceutical, agri-food, cosmetic, “medical device”, etc.).
- Product specifications, defined in the dossier. These specifications include a margin for production variability, sampling and analytical variability. The space “available” between the specification limits should therefore be shared between production and analytics and a safety margin retained to avoid potential OOS results because of analytical variability.
- The use that will be made of the method and the results that will be obtained from it.
There are many empirical descriptive criteria in the pharmaceutical field. We can recommend viewing the YouTube video shared by Oona McPolin (https://www.youtube.com/watch?v=Vz2TUIeMjY0) which explains the origin of some of the criteria classically encountered.
We will not provide examples in this article, as they could only be examples, which must be adapted to the context of your analysis, and to the already known performance of your method.
We can however highlight some classic errors to be avoided:
- Inappropriate statistical criteria. Some statistical tests (Cochran, Fisher, Student) can provide you with information on data generated in validation exercises. However, because of the small number of data generated, these tests are not always conclusive. And they rarely prove that your method generates or does not generate reliable results. Use of these tests was common practice, but it is strongly advised not to use the conclusions of these tests as acceptance criteria.
- Overly broad criteria. While this could “facilitate” the drafting of a validation report, having overly broad criteria will not guarantee the reliability of the measurements that will be generated subsequently.
- Overly narrow criteria (inappropriate). An example of a “bad” practice sometimes observed is a systematic bias criterion for impurities set at a very low level in the validation protocol, without taking account of the bias that will subsequently be introduced by rounding off the results (for example: maximum bias = 5% for a impurity that should be lower than 0.5%, while rounding off a result obtained of 0.25% to 0.3% in itself represents a bias of 20%). Another example involves the interference level acceptable in a specificity study. As indicated in Figure 2, interference can generate a systematic bias. But if, for example, a total systematic bias of 2% is accepted, it does not seem logical to then limit each interference to an extremely low level (0.05%, for example). But if a narrow criterion is established for reasons of patient safety (and therefore appropriate), we can only encourage you to do likewise.
Limits should therefore be established for each validation criterion, but without forgetting that they are interlinked, as illustrated in Figure 2. The fundamental limits are therefore those fixed for systematic error and random error, the two lynchpins of uncertainty. The other limits allow better definition of some sources of these 2 errors to be characterized.
The combination of both errors through total error (combined) remains the best way of monitoring the reliability of the measurements that will be generated. Among the criteria for the combination of 2 sources of error, can be found criteria for the capability of a method and graphs including risk level curves (Operating characteristic curves),[12, 13] which are simple methods for estimating the level of analytical risk, without however allowing real management of these risks.
The current trend is towards the accuracy profile and its tolerance interval[13] or the Prediction interval[4] statistical tools which are a little more complex but more powerful as they allow the analytical risk to be managed and controlled.
In any case, the determination of these acceptance limits is crucial and must be made, of course to meet regulatory requirements, but also to ensure that the analytical procedure will be scientifically effective, that is that it will be true and precise (see Figure 1).
5. After validation
After a method has been validated, it is strongly advised to place it “under surveillance“.
Day-to-day surveillance lies in the compliance of fixed criteria in compliance testing of the analysis system (SST= System Suitability test). Depending on techniques and the objective of methods, these tests include signal quality criteria (symmetry of peaks, etc.) criteria for correct functioning of equipment (repeatability of measurements, in particular), test solutions, chromatographic criteria for separation methods, etc.
In addition to the control chart that is classically deployed for the results of different product batches, the trend is towards the introduction of a control chart for different SST parameters (criteria for resolution, peak symmetry, measurement repeatability, quality control monitoring (internal or external), etc.) in order to anticipate deviations or potential malfunctions, which will be easier to detect.
Moreover, in the event of change, the requirement for partial or total revalidation must be evaluated according to need. The ICH Q2(R1)[1] cites the following (non-exhaustive) changes which lead to revalidation:
- Changes in synthesis of the drug substance, generally including its source.
- Changes in finished product composition.
- Changes in analytical procedure.
A change of laboratory is generally managed in the form of an analytical transfer, which may be the subject of inter-laboratory studies or (total or partial) revalidation studies within the recipient laboratory. In any case, a thorough knowledge of the method, its sources of variability to be controlled and its performance are all resources that fuel your risk analyses and limit these requirements for revalidation to just the tests that are relevant to the planned change.
Conclusion
As indicated in the foreword, it is not possible to address all specific cases which may be encountered in validation in just a few pages.
ICHQ2(R1) emphasizes the responsibility of MA holders to demonstrate, with a suitable protocol, that the method displays sufficient performance for the use that will be made of the method.
Current trends[5,6] put the one-time validation exercise in its place, between an analytical development which allows the attainment of an appropriate level of control, and monitored use.
We are also very aware that some regional requirements will go against the elements proposed in this article. Each person should add the criteria and the statistical tests specifically required in individual countries to their validation protocol.
The main message will remain that ultimately, knowledge of the uncertainty of the result is the main objective of a validation. This uncertainty is linked to the total error, the combination of systematic error and random error which remain inseparable in routine analyses.
The article that follows will demonstrate the importance of this total error.
Share article


Eric Chapuzet – Qualilab
Eric est Directeur Général de QUALILAB, société spécialisée dans le conseil en management de la qualité, sur le cycle de vie de méthodes d’analyse, les systèmes d’informations, l’intégrité des données et l’analyse de données. De formation scientifique (statistique, informatique, qualité, physiologie, pharmacologie, biochimie), il participe régulièrement à des projets de validation et transfert de méthodes analytiques. Éric anime et réalise également des formations et des audits dans le cadre des étapes du cycle de vie des méthodes d’analyse depuis de nombreuses années.

Gerald de Fontenay – Cebiphar
Depuis plus de 25 ans, Gérald a assuré différents postes au sein de sociétés de services analytiques et de CDMO. Aujourd’hui Directeur Scientifique et Technique chez Cebiphar, il continue à œuvrer pour garantir le maximum de fiabilité aux résultats qui sont générés dans ses laboratoires. Il apporte son expertise en validation, vérification et transfert de méthodes analytiques auprès des chefs de projets et des clients de Cebiphar, pour assurer le succès des projets qui lui sont confiés.
gdefontenay@cebiphar.com
Marc François Heude – Siegfried
Titulaire d’un doctorat en chimie organique, Marc assure, depuis 6 ans, des rôles de chef de projets analytiques d’abord à Adocia (Société de biotechnologie Lyonnaise) puis à Bayer Healthcare. Il exerce aujourd’hui en tant que responsable du service de développement analytique chez Siegfried, un CDMO de l’industrie pharmaceutique qui produit des APIs et intermédiaires de synthèse.
References
[1] : ICH Q2 (R1) “Validation of Analytical Procedures: Text and Methodology”, 2005. [2] : FDA: 21CFR : Current Good Manufacturing Practice (CGMP) Regulations, 2020.
[3] : EudraLex – Volume 4 – Good Manufacturing Practice (GMP) guidelines. [4] : US Pharmacopoeia: USP <1210>; <1225>; <1226>.
[5] : FDA Guidance: “Analytical Procedures and Methods Validation for Drugs and Biologics”, 2015.
[6] : Pharmacopeial Forum (PF), 1220 Analytical Procedure Life Cycle — PF 46(5), 2020.
[7] : USP stimuli to revision process 42(5) ANALYTICAL CONTROL STRATEGY, 2016.
[8] : J. Ermer, C. Burgess, G. Kleinschmidt, J. H. McB. Miller, D. Rudd, M. Bloch, H. Wätzig, M. Broughton et R. A. Cox, Method Validation in Pharmaceutical Analysis: A Guide to Best Practice, Wiley, 2005.
[9] : ICH Q3A(R2) IMPURITIES IN NEW DRUG SUBSTANCES, 2006.
[10] :ICH Q3B(R2) IMPURITIES IN NEW DRUG PRODUCTS, 2006.
[11] : ICH Q3C(R8) IMPURITIES:GUIDELINE FOR RESIDUAL SOLVENTS, 2021.
[12] : ICH Q3D(R1) GUIDELINE FOR ELEMENTAL IMPURITIES, 2019.
[13] : P. Hubert, J.-J. Nguyen-Huu, B. Boulanger, E. Chapuzet , P. Chiap, N. Cohen, P. Compagnon, W. Dewé, M. Feinberg et
M. Lallier, «Validation des procédures analytiques quantitatives harmonisation des démarches,» S.T.P. Pharma Pratiques, vol. 13, p. 101, 2003.
[14] : USP <1080> “BULK PHARMACEUTICAL EXCIPIENTS— CERTIFICATE OF ANALYSIS”, 2021.
[15] : Small Molecules Collaborative group and USPC Staff. Pharm Forum 35(3) page 765 – 771, 2009.
[16] : G. de Fontenay, J. Respaud, P. Puig,
C. Lemaire, «Analysis of the performance of analytical method, Risk Analysis for routine use,» S.T.P. Pharma Pratiques, vol. 21, n°12, pp. 123-132, 2011.
