
Sommaire
- The alternatives and rapid Microbiological methods & Pharmacopeias world
- Industry pivots to rFC adoption: Reshaping the Endotoxin Test & Regulatory Landscape
- Rapid Bioburden & Sterility Testing: exploring Detection Limits of an Automated Solid Phase Cytometry System
- The Myth of Testing Colored Samples: Debunked
- Design of smart galenic models (stimuli-sensitive) for the formulation of active molecules
- How process sufficiency can help pharma industries achieve their carbon footprint reduction targets?
- Advancing Sustainability: Recycling Single-Use Technology in the Pharmaceutical Industry
Rapid Bioburden & Sterility Testing: exploring Detection Limits of an Automated Solid Phase Cytometry System
Compendial microbiological methods have been widely used for the detection and quantification of microorganisms. These methods are renowned for their reliability, simplicity and consistent performance over decade establishing them as the gold standard. While well defined, their drawback lies in their slow and time- consuming nature. In contrast, alternative approaches, such as solid phase cytometry, have demonstrated the potential to yield faster results.

These compendial methods rely on the detection of microorganisms through their multiplication. In the case of sterility testing, multiplication occurs within two liquid mediums allowing the observation of turbidity caused by microbial growth after 14-days of incubation[1]. Meanwhile, in bioburden assessment, colony forming unit (CFU) are enumerated on solid phase agar plate after a 5-days incubation phase.[2].
Due to short shelf life of some biological products and the push from industries to obtain faster results, alternative and rapid microbiological methods are required. Solid phase cytometry holds the promise of expedited results[3]. The Red OneTM instrument, utilizing automated solid phase cytometry, incorporates advanced image processing techniques to enable real-time detection of viable cells, distinguishing them from background debris with a high degree of reliability. Detecting very low inoculum levels using these methods can pose significant challenges for several reasons:
- The ability to automatically detect rare events within the background noise
- The need for post-analysis identification in the event of a confirmed contamination.
A strategy involving preliminary activation or enrichment phases before the microorganisms’ detection step can enable to achieve very low detection levels in just a few hours to several days, as opposed to the several days to two weeks (required for sterility tests) to yield results. In accordance with the pharmacopeia chapters[4,5] addressing the implementation and utilization of alternative microbiological methods, several critical parameters must be assessed, including the limit of detection (LOD), the limit of quantification (LOQ), and an often underestimated yet crucial criterion in evaluating the performance of rapid systems, the limit of blank (LOB).
In this paper, we will assess various options for detecting contamination in pharmaceutical matrices using the Red OneTM solid phase cytometer focusing on their impact on LOD/LOQ/LOB criteria and time-to-result (TTR). Results will be presented for various matrices, including those with low background levels (less than 1,000 particles per test) and those with higher background, such as Fluid Thioglycollate medium (FTM) for sterility testing.
1. Red OneTM technology, new generation of solid phase cytometry
Red OneTM is a fully automated microbiology platform that detects stained single cells based on their metabolic activity. Suited for any lab setup, Red OneTM integrates easily into a laminar flow hood and has proven a highly reliable detection capacity of individual cells by monitoring their staining kinetics. Key features are:
- Sample Size: 10 μL to 250 mL
- Single-Use cap: based on a track-etched PET membrane (0.4 μm)
- Calibration-Free Operation.
All operations, including filtration and labeling, are fully automated. The system labels microorganisms using a fluorescein diacetate derivative sensitive to cell esterase activity.
Red OneTM employs a high-power LED lighting (excitation: λexc = 485nm) and a high-resolution CMOS sensor camera (emission: λem = 520nm), reducing equipment size and cost.
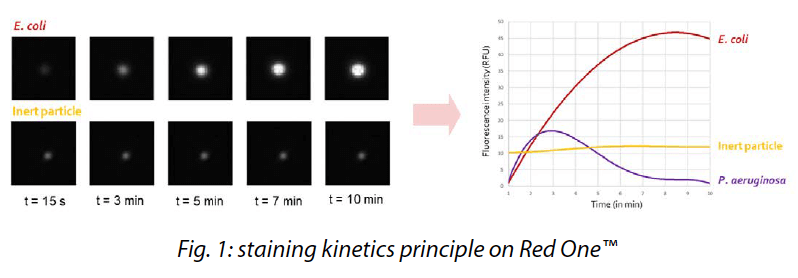
High-resolution images capture microorganisms before, during, and after introducing the viability staining agent over a 10 to 15 minutes period. This fluorescence evolution during the time, so-called staining kinetics (patented by Redberry), allows reliable differentiation of viable cells from inert particles, such as those exhibiting auto-fluorescence (Fig. 1).
2. Viability labeling using fluorescein derivative: activation & growth strategy
The use of a fluorescein derivatives to label viable cells is a method proven to be very sensitive provided that the microbiological flora of the samples to be analyzed is sufficiently metabolically active. Indeed, microorganisms in sporulated form or stressed germs for instance may not emit sufficient fluorescence. This usually requires an activation phase to ensure that (i) the staining agent can enter the cells and (ii) it could emit a sufficient level of fluorescence to be detected.
Since staining single microorganisms is always toxic to some extent, an enrichment step is mandatory to recover viable microorganisms if post-identification is required for the application. Pharmaceutical Quality Control applications often demand the lowest possible analytical sensitivity (1 CFU for a sterility test).
The challenge for any system based on viability staining is that the fluorescence emitted by microorganisms can be distinguished from the background noise to confirm or deny the presence of a microorganism. This often requires a post-analysis confirmation with a microscope by an operator. Red OneTM being fully automated, it avoids any potential bias from the operator.
This analytical sensitivity is determined by the LOB, LOD, and LOQ criteria (Fig. 2). LOD and LOQ can be estimated using blank measurements, similar to the LOB[6,8].
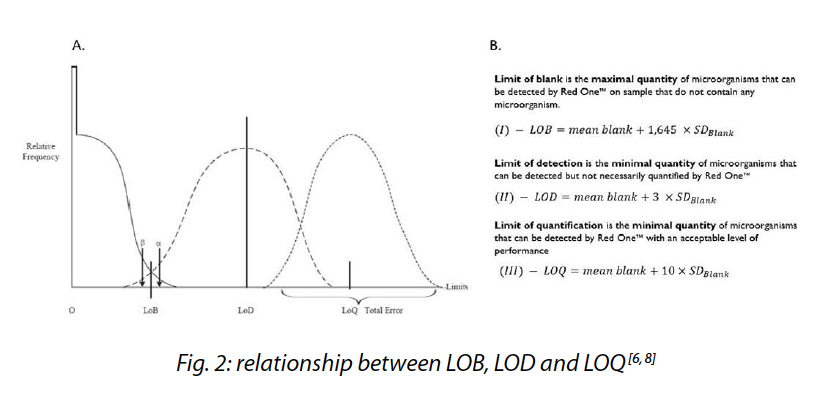
Therefore, the LOB quantifies the background noise of the Red OneTM system. Below this limit, the system cannot reliably discriminate between particles and microorganisms, leading to a risk of false positives.
This value should hence be low to distinguish rare events from the matrix background noise. In the case of an analysis using Red OneTM, microorganisms in the matrix must have a sufficient metabolic activity and a membrane integrity that enables them to exhibit a staining kinetics different enough from inert particles (matrix background noise).
To achieve this, several strategies are applied:
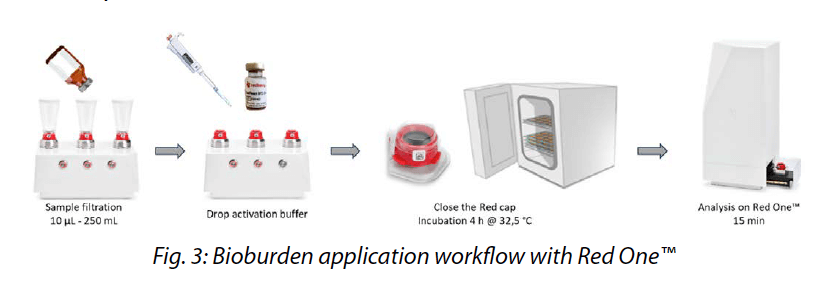
Activation step: This approach allows fragile or stressed microorganisms to recover metabolic activity and a membrane integrity sufficient to be stained with a kinetics. This activation phase can occur directly on the solid-phase consumable, similar to a Petri dish, and deliver results within a few hours (3-4h), the time required for microbial activation. This method is used for Red OneTM Bioburden application as the results remain quantitative due to solid phase activation (Fig. 3).
Enrichment step: This allows a single cell to multiply sufficiently and then exceed the positivity threshold set by the system’s LOB. With this approach Red OneTM gives a qualitative result indicating the presence or absence of microbial cells in a matrix.
Red One BB – 0 CFU application is a qualitative test for the presence/ absence of total aerobic flora after a 24 h enrichment phase directly on Red Caps consumables. Following a 24-hour enrichment, the consumable is analyzed on Red OneTM for 10 minutes.
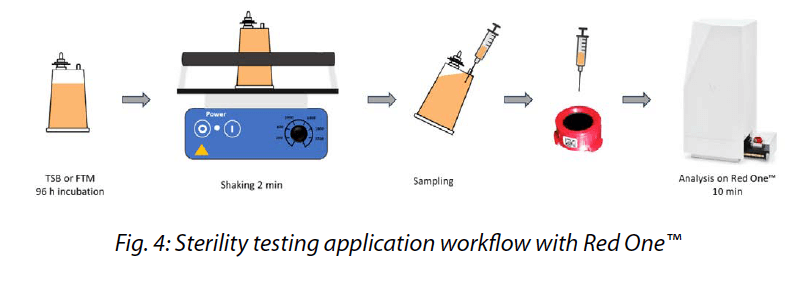
Red OneTM “Sterility Sample & Analysis application strictly relies on compendial sample preparation in a standard double-canister device. A small volume from the canister, typically ranging from 1 to 5 mL, is sampled and analyzed on Red OneTM (Fig. 4). The liquid- phase enrichment allows the detection of a single CFU in a matrix, no longer providing a quantitative result but a qualitative one (presence/ absence). Therequired enrichment period is 96 hours.
The system achieves a short Time to Result (TTR) due to its unique capability to detect single microbial cells. This is in contrast to traditional visual inspection methods (turbidity or colonies on a plate) that require a considerably higher microbial population (typically on the order of 108 cells) to confirm a positive result. For sterility testing and, in certain cases, for bioburden testing, the identification of contaminating microorganisms is mandatory. Some existing studies indicate a post-labeling recovery issue, particularly for gram-negative bacteria[9].
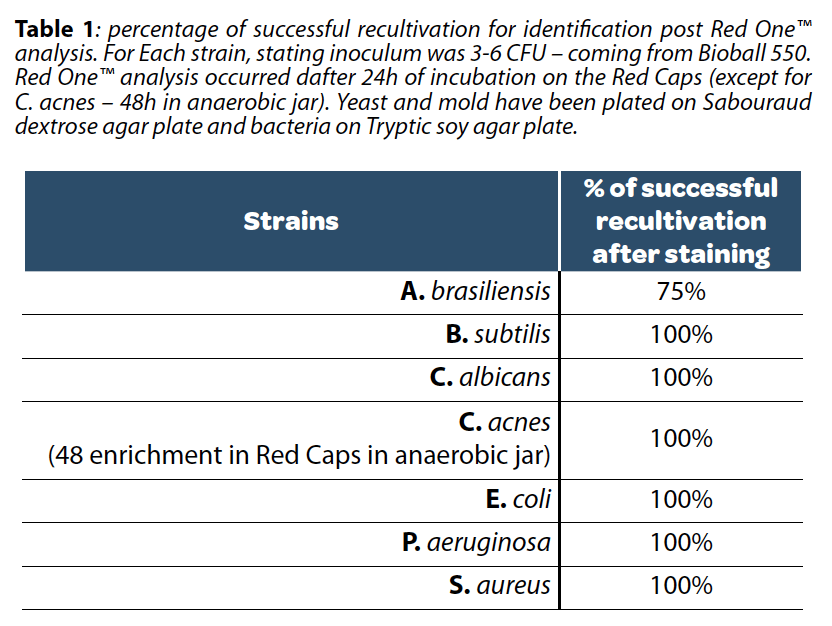
One advantage of post-enrichment analysis is that the concentration of microorganisms is no longer in the range of a few CFUs but rather above hundreds. Additionally, during an analysis with Red OneTM, the contact time between microorganisms and the staining agent does not exceed 15 minutes (Table 1), thereby minimizing the risk of toxicity.
For sterility testing with Red OneTM, the toxicity of the staining agent is not a concern, as the culture media remains in the canister after sampling a few milliliters for Red OneTM analysis. Users can then perform identification using their standard operating procedure in the case of contamination.
3. LOB/LOD & LOQ for Quantitative Bioburden applications
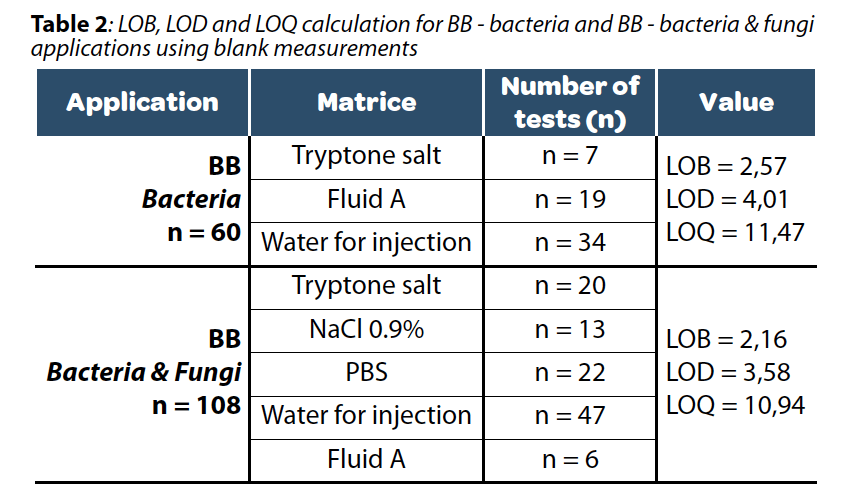
A cohort of negative sterile samples was used to calculate the LOD and LOQ on Red OneTM with so- called “clean matrices”, meaning with a very low background level (<1000 inert particles). Determining LOB, LOD, and LOQ criteria on blank matrices is straightforward, as indicated in Table 2. However, these criteria alone are not sufficient to confirm that a low concentration of the analyte will indeed generate a signal distinguishable from a blank sample with zero concentration.
We then compared the Red OneTM bioburden application to the compendial method using a very low inoculum. Multiple microbial contamination levels (50 – 5 – 0.5 – 0.05 CFU) were employed, and the Most Probable Number (MPN) technique was applied to compare the alternative method with the compendial one. If the confidence levels overlap, and the non-inferiority test is not significant, the methods can be considered equivalent[10].
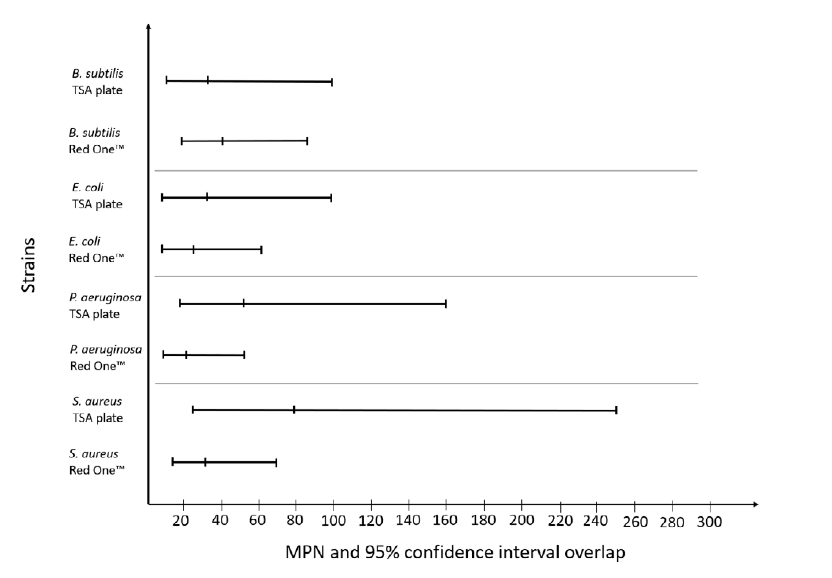
Fig 5: MPN and non-inferiority testing between Red OneTM BB – bacteria application and agar plate count. Bacterial strains come from Bioball® 550 CFU (BioMérieux) and ten folds dilution have been applied – 4 dilutions and 5 replicates for each. Numeration on Red OneTM have been performed using BB – bacteria application. Agar plate count have been performed using TSA plate (BioMérieux) incubated 24h @ 32.5 °C.
Fig. 5 indicates that, in all cases, the 95% confidence intervals of the compendial method and Red OneTM bacteria application overlap. Performing an exact Fisher test on these data does not reveal any statistical difference between the two methods at low inoculum. Based on these tests, the Limit of Detection (LOD) of Red OneTM can be considered equivalent to the compendial method.
Nevertheless, after calculating the method’s noise on a clean matrix and obtaining a value of 2.07 cells (Table 2), it is clear that Red OneTM cannot reliably differentiate inert particles from viable particles at these concentrations. Consequently, for the validation of an alternative method, it is crucial not to depend solely on LOD calculation methods but to meticulously take into account these two parameters. Therefore, Redberry, adopting a conservative approach to avoid the necessity of confirming these objects via a microscopic analysis, asserts a LOD of 5 viable cells for the BB applications.
4. LOB & positivity threshold for Sterility application
For sterility testing, the LOD is mandated to be at 1 CFU according to Ph. Eur. 2.6.1[3] and USP <71>[11]. To achieve such sensitivity, an incubation phase is required to allow the multiplication of the initial microorganism. With the compendial method, a 14-day incubation period is necessary for visually detecting contamination. As the Red OneTM system has a much higher sensitivity than visual detection methods, the time-to-result can be reduced as little as 96 hours.
This time-to-result is associated with the determination of LOB calculated from blank samples. It is essential to establish the method’s positivity threshold in accordance with the background noise generated by the broth used for the sterility test in order to avoid any false-positive results. False-positive results can be due to either background noise or microbial contamination during sample preparation.
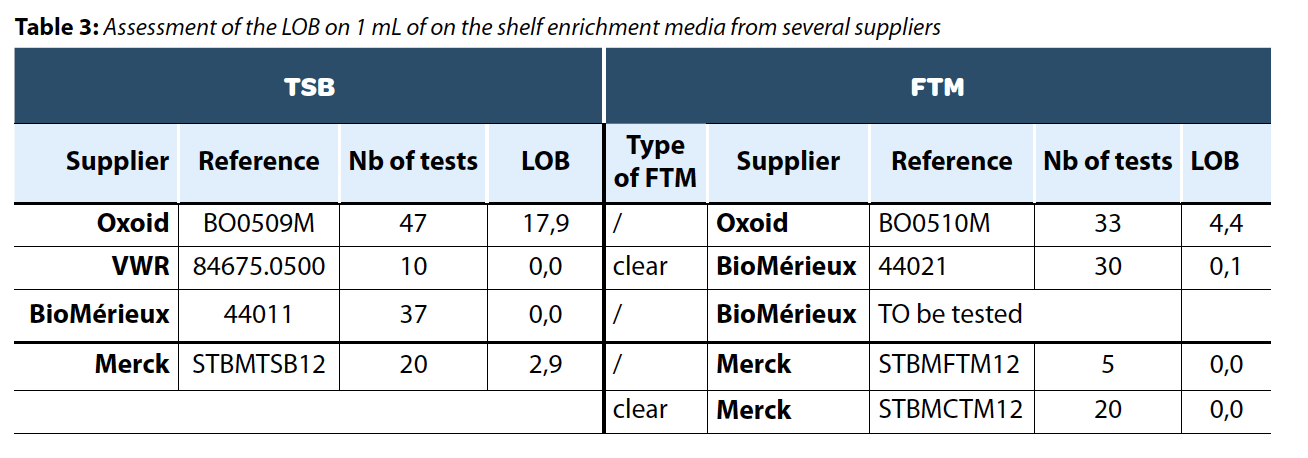
Different on-the-shelf media (TSB, FTM, and FTM clear) were tested to evaluate their respective background noise levels. Six TSB and seven FTM were tested during the study, and the background noise has been assessed on each media using the LOB formula. The main results of this study are summarized in Table 3.
While the composition of the growth media is identical across these products, we observed differences among suppliers that led to variations in background noise resulting in disparities in the LOB. To ensure product positivity with a 95% confidence interval, the positivity threshold must be set higher than 18 viables cells detected per tested sample as presented in Table 3.
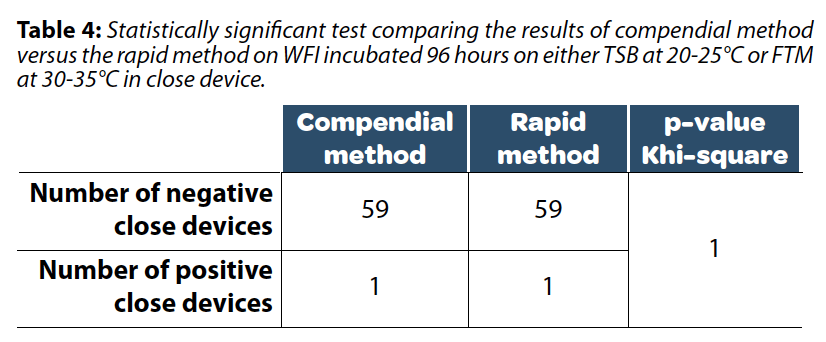
As presented in Table 4, with a positivity threshold set at 25 viable cells detected per tested sample, no significant differences in results were observed between the compendial and the rapid method indicating an absence of false positive results due to background noise. This threshold could be further reduced by excluding media that generates excessive background noise. In this data set, one result was positive with both rapid and compendial methods. Contamination occurred during the preparation of closed devices and was subsequently confirmed, thus explaining this positive result.
These tests conducted on blank samples established a suitable 
5. Conclusion
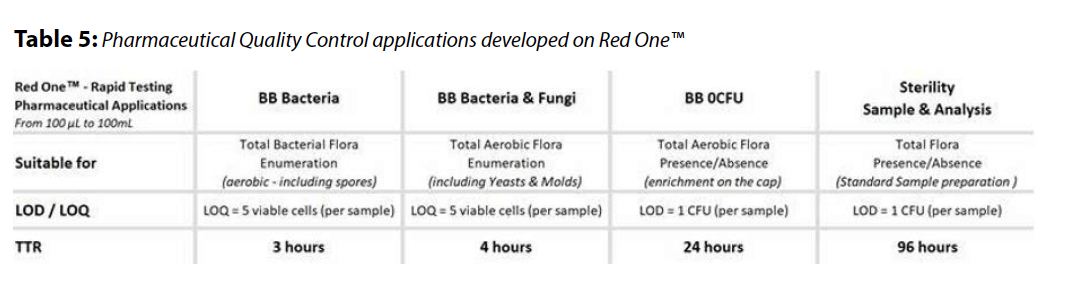
This study showcases the Red OneTM automated solid phase cytometry system as a rapid and reliable alternative for bioburden and sterility testing. The system, with its advanced image processing techniques based on staining kinetics, offers quicker results compared to traditional compendial methods (see Table 5).
Key parameters such as limit of detection (LOD), limit of quantification (LOQ), and limit of blank (LOB) are explored, emphasizing the importance of analytical sensitivity. The system demonstrates equivalence to compendial methods in quantitative bioburden applications, with careful consideration of LOD and LOB parameters. For sterility testing, the study highlights the necessity of establishing a positivity threshold aligned with background noise. Evaluation of on-the-shelf media reveals variations among suppliers, leading to a proposed positivity threshold to minimize false positives and expedite results from 14 days to 4 days.

References
- (1) European Pharmacopoeia Commission, “Chapter 2.6.1. Sterility,” in European Pharmacopoeia, 7th ed.; Council of Europe: Strasbourg, France, 2010
- (2) European Pharmacopoeia Commission, “Chapter 2.6.12. Microbiological Examination of Non-sterile Products: Microbial Enumeration Tests,” in European Pharmacopoeia, 7th ed.; Council of Europe: Strasbourg, France, 2010
- (3) Smith, R., Von Tress, M., Tubb, C., & Vanhaecke, E. (2010). Evaluation of the ScanRDI® as a Rapid Alternative to the Pharmacopoeia Sterility Test Method: Comparison of the Limits of Detection. PDA Journal of Pharmaceutical Science and Technology, 64, 356-363.
- (4) European Pharmacopoeia Commission, “Chapter 5.1.6. Alternative Methods for Control of Microbiological Quality,” in European Pharmacopoeia, 7th ed.; Council of Europe: Strasbourg, France, 2010
- (5) United States Pharmacopeial Convention, “Chapter <1223> Validation of Alternative Microbiological Methods,” in The United States Pharmacopeia and the National Formulary; USP 34-NF 29; United States Pharmacopeial Convention: Rockville, MD, 2011
- (6) Armbruster DA, Pry T. Limit of blank, limit of detection and limit of quantitation. Clin Biochem Rev. 2008 Aug;29 Suppl 1(Suppl 1):S49-52. PMID: 18852857; PMCID: PMC2556583.
- (7) Taleuzzaman, M. (2018). Limit of Blank (LOB), Limit of Detection (LOD), and Limit of Quantification (LOQ). Organic & Medicinal Chemistry International Journal, 7(5), 127-131
- (8) Shrivastava, A. and Gupta, V. (2011) ‘Methods for the determination of limit of detection and limit of quantitation of the analytical methods’, Chronicles of Young Scientists, 2(1), 21
- (9) Grosselin J, Palazuelo M, Girard V, Monnin V, Saccomani MC, Wittemberg V, Montero-Julian F. Easy post-scan growth method provides combination of rapid industry relevant microorganisms quantification and identification with ScanRDI and VITEK® MS (poster). 2015 PDA Pharmaceutical Microbiology Conference. Washington DC.
10. PDA Technical Report No. 33. Evaluation, Validation and Implementation of New Microbiological Methods; Parenteral Drug Association, Inc.: Rockville, MD, 2000.
Partager l’article