


Summary
- Control strategy and robotics: the future of production sites?
- Robotized loading of cartridges at Lilly
- Small, flexible filling and packaging systems - using robots could mean great benefits
- Automated and instantaneous enumeration of viable microorganisms with Red One™, solid-phase cytometry platform
- Method analatycal performance strategy in commercial quality control laboratories
- “Replicate strategy*”: but what is it exactly?
- A3P International Congress 2020: Feedback and key messages from the Annex1 revision process panel discussion
- Regulatory compliance: a re-evaluation of strategic subcontracting relationships in the “new normal”
“Replicate strategy”: but what is it exactly?
As Molière’s Monsieur Jourdain spoke in prose without knowing that he did so, many analysts apply a “replicate strategy”, without realizing it either.
In fact, some tests described in the Pharmacopeias are based on a mean of several measurements and/or several determinations obtained from several samples from the same finished product batch (content uniformity, dissolution testing, for example), indeed even several series of analyses on the same batch (titration of antibiotics or ELISA tests, for example).

Other “Replicate Strategies” may also originate from rules laid down in internal procedures: duplicate injections in HPLC = duplicate measurements, for example.
Chapter <1220> published in Pharmacopeial Forum[1] proposes many approaches to an improved understanding of the lifecycle of analytical methods, in particular the notion of “Replicate strategy”.
This text is a prelude to the future guideline ICHQ14 which will focus on AQbD (Analytical Quality by Design), a voluntary approach for carrying out reasoned analytical development, which takes account of the anticipated use of the method, as well as the final users of these methods.
Making the life of the final user easier is indeed an essential quest for all analytical development players.
We will describe how a “Replicate strategy” supports this quest. The aim of this article is to address the concepts of uncertainty, which can discourage or even frighten our analysts, in a pragmatic manner in order to reap the rewards that every laboratory secretly dreams of => reducing the risk of generating out of specification results which will not be confirmed and thus reducing the documentation necessary to investigate and track the decisions that will be taken.
All the more so as invalidation of an analytical result is always a tricky task, that must be justified clearly.
1. Context and definitions
Sources of variability
The aim of a “replicate strategy” is to reduce the impact of the sources of variability of an analytical method.
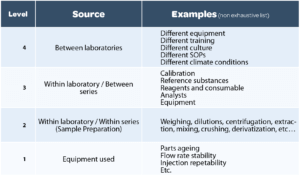
Each method has its different sources of variability, and a thorough study of this variability (during the development and validation of the method) is necessary to adopt an effective test repetition strategy. The 4 major sources of variability are summarized in Table 1.
It is impossible to control all sources of variability. But the different sources originating from the steps of the analytical process itself should be understood and tamed. When development is completed, validation of an analytical method will allow the residual variability that will impact the reliability of measurements obtained with this method to be measured.
During method validation, a Precision Assessment (reliability) serves to study the spread of the data (calculation of variances, standard deviations and Relative Standard Deviations (RSD), and also assesses:
- A repeatability RSD: proportional to the breadth of levels 1+2 in the previous table;
- An intermediate precision RSD: proportional to the breadth of levels 1+2+3.
Level 1 is checked regularly (periodic qualification of equipment and System compliance tests for each series of analyses). It may however vary from one day to another, and this impacts the calculation of the intermediate precision RSD.
Level 2 is representative of sample preparation. It is the variability observed over several determinations from the same homogeneous sample. This consists in repeating the paragraph “sample preparation” of the analytical procedure several times.
The more complex this preparation, the more this level will be liable to be a source of significant variability. The quality of the description of sample preparation, like the information provided on preparation methods, duration of agitation, the expected appearance of samples after each treatment step, are all elements that will enable different variability between one analyst and another to be avoided.
Level 3 corresponds to the variability observed between the means of different analysis series on the same homogeneous batch. This corresponds to repeating the analytical procedure in its entirety several times: preparation of reagents, diluents, reference solutions, etc. Several analysts and equipment items may be involved during the series carried out over several days during validation of the method.
Thus the variability between series corresponds to the variability inherent in the weighing and preparation of calibration solutions, to which may be added an equipment effect, an analyst effect, and a modifying effect of climatic conditions from one day to another (temperature, humidity, sunshine). The preparation of a reference solution is not generally complex, but the greatest attention must be paid to this in order to limit such inter-series variations, which are very damaging to the quality of the results obtained with the method.
Level 4 corresponds to a potential variability between several laboratories, which is not generally assessed during validation. Such variability exists because of different working practices from one laboratory to another (procedures, training, culture, etc.) and sometimes, different working environments (temperature, humidity, light, etc.). This variability is analyzed during the analytical transfer steps that punctuate the lifecycle of analytical procedures.
In the context of the definition of a “Replicate strategy”, we will linger on the potential impact of the breadths of the 2nd and 3rd levels, or in a more practical and pragmatic fashion, on the analysis of the repeatability and intermediate precision RSDs calculated during validation.
Value of a “Replicate strategy”
Each individual measurement, routinely in the laboratory, will be subject to all sources of variability and may vary with a RSD close to the intermediate precision RSD defined during validation.
Comment: It is good to know that around 95% of individual values are located between -2xSD and + 2xSD (with the hypothesis of a normal distribution of data, which is most often the case for quantitative analyses performed in the pharmaceutical industry). It is therefore essential to understand, control, and reduce variability as much as possible during the development of the analytical method.
The aim of a “Replicate strategy” is to define the number of measurement series and measurements per series to define a mean result, which will be the result reported in an analysis report and compared to the product specifications. No longer comparing each individual measurement greatly reduces the management of OOS results.
=> Repeating several analyses in the same series reduces the impact of the 2nd level, while carrying out several series reduces the impact of the 3rd level.
Several definitions and calculations
Standard deviation and Relative Standard Deviation (RSD)
During method validation, precision data are exploited through an Analysis of Variance (ANOVA).
This analysis of variance allows the breakdown of the total variance observed during n series of p repetitions into:
- a repeatability variance S2w (w for within group)
and Sw the standard deviation of repeatability,
- an inter-series variance S2b (b for between groups)
and Sb the inter-series standard deviation,
- an intermediate precision variance S2IP = S2w+ S2b
and SIP the intermediate precision standard deviation.
For each of the standard deviations calculated, the RSD, which is the ratio of standard deviation to the mean, can be defined, expressed as a percentage of the mean. For simplicity, to illustrate the value of a “Replicate strategy”, we will take the mean= 100, which gives an RSD = standard deviation/mean x 100 = standard deviation.
The repeatability RSD is therefore then equal to the standard deviation of repeatability Sw, and is proportional to the breadths of levels 1+2, while the intermediate precision RSD is then equal to the intermediate precision standard deviation SIP and is proportional to breadths 1+2+3.
Standard deviation of a mean
The standard deviation of a mean of n results is reduced by a factor √n relative to the initial standard deviation (where the variance is reduced by a factor n).
In the present case, if during the quantitative analysis we carry out p series, with n repetitions per series, the repeatability variance will be reduced by a factor n x p and the intermediate precision variance will be reduced by a factor p. Repetitions therefore have the effect of reducing the breadth of the levels evaluated during the validation.
=> Averaging several measurements therefore reduces the uncertainty associated with the mean result calculated in this way.
Uncertainty of measurement
Here again, the aim is to understand the concept of uncertainty, and not to give all the definitions of this existing in the literature. I therefore thank readers for not blaming me for the potential uncertainty of my remarks on uncertainty…
The uncertainty of a measurement is directly linked to the variability of the method used to generate it. Each measurement is indeed only an estimation of the “true” value, approximating to this true value to a greater or lesser degree.
From a mathematical perspective, it is in the form U=k.√variance, with k a coverage factor, a statistical constant associated with a probability (for a normal distribution and a probability of 95%, k=2 is frequently used: this concurs with the comment made previously).
With the results of the validation, variance is broken down into intra-run and inter-run variance.
So, the associated uncertainty is U=k.√(S2w + S2b).
For a result derived from the mean of p series, with n repetitions per series, the uncertainty of this mean result (U’) can be defined with the following formula, described by Schofield et al.[2]
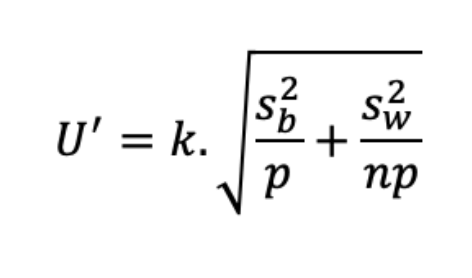
So, uncertainty decreases when n and/or p increases.
Knowledge of the relative importance of the 2nd and 3rd levels of the sources of variability allows the precise determination of whether it is better to increase n, p, even both to obtain a mean result with an uncertainty below the level that can be tolerated.
2. Analysis of different scenarios
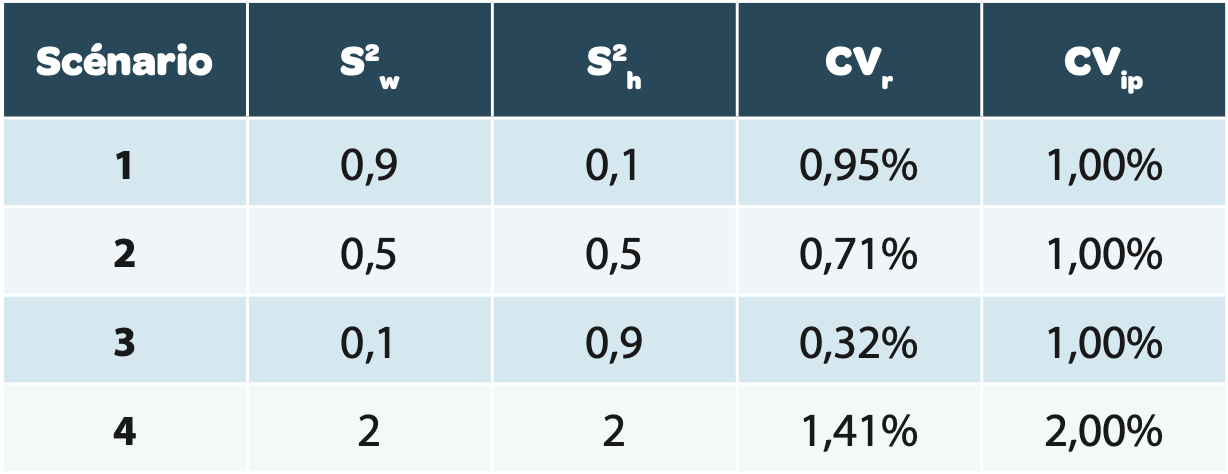
The use of the uncertainty formula of the mean result U’ is simulated in different scenarios summarized in Table 2.
Reminder: for calculation of the RSD of different scenarios, the mean value is taken at 100%.
Explanation of different scenarios
For scenarios 1 to 3
The CVIP is identical (corresponding to the breadth of levels 1, 2, and 3), but the variability is distributed differently between the intra-series (level 1+2) and the inter-series (level 3):
For scenario 1
The breadth of the 3rd level is small relative to the 2nd.
For scenario 2
The variability is equally distributed between the intra- and inter-series. This corresponds to the example provided in the stimuli of the USP[2].
For scenario 3
The breadth of the 3rd level is large relative to the 2nd.
For scenario 4
The CVIP reaches 2% with variability distributed between the intra- and inter-series, in order to illustrate the significant impact of an increase in general variability on global uncertainty.
Analysis of the different scenarios
For these different scenarios, the impact of variations of p (1, 2 or 3 separate series) and of n (1 to 6 repetitions per series) is represented graphically with a curve per value of p and number of repetitions per series, n, on the X axis:
On reading the curves, it is easy to define the analytical procedure in terms of the number of series and repetitions per series to define a mean result with a reduced uncertainty below a threshold that will have been set in advance.
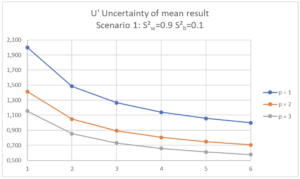 | Scenario 1 (RSDr=0.95%, RSDip=1.0%) In this Scenario 1, we see that increasing n or p has an effect on the uncertainty of the mean result. If the maximum uncertainty of the mean result is set at 1.5%, it will be sufficient to define a strategy with n = 2 repetitions within the same analysis series (p=1, n=2). This will be easier to organize in the laboratory than the alternative of 2 separate series with a single determination per series (p=2, n=1). If the maximum uncertainty of the mean result is set at 2.0%, a single determination in a single series will be sufficient (p=1, n=1). |
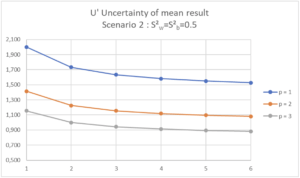 | Scenario 2 (RSDr=0.71%, RSDip=1.0%) In this Scenario 2, we see that increasing p has more effect on the uncertainty of the mean result than increasing n. If the maximum uncertainty of the mean result is set at 1.5%, it will be necessary to organize 2 separate series in the laboratory with at least one determination per series (p=2, n=1). If the maximum uncertainty of the mean result is set at 2.0%, a single determination in a single series will be sufficient (p=1, n=1). |
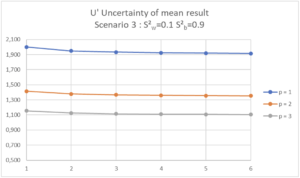 | Scenario 3 (RSDr=0.32%, RSDip=1.0%) In this Scenario 3, we see that increasing n has almost no effect on the uncertainty of the mean result, as the variability is essentially inter-series. If the maximum uncertainty of the mean result is set at 1.5%, it will be necessary to organize 2 separate series in the laboratory with one determination per series (p=2, n=1). If the maximum uncertainty of the mean result is set at 2.0%, a single determination in a single series will be sufficient (p=1, n=1). |
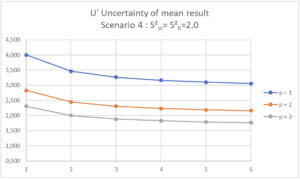 | Scenario 4 (RSDr=1.41%, RSDip=2.0%) In this Scenario 4, the variability of the analysis is such that no reasonable “Replicate strategy” in terms of Quality Control laboratory activity would ensure an uncertainty of the mean result below or equal to 1.5%. |
If the maximum uncertainty of the mean result is set at 2.0%, 3 series with at least 2 repetitions per series should be envisaged (p=3, n=2).
Everyone should define clearly the maximum uncertainty that they will be able to tolerate for the result that they wish to obtain to define the right “Replicate strategy” suited to their method. This uncertainty will depend on product specifications, in combination with the therapeutic index of the compound tested.
In an article[3], Barnett et al. propose setting the maximum uncertainty at 60% of the range of specifications.
For a specification set at between 95.0 and 105.0%, the range of specification around the target value is ±5.0%.
The maximum uncertainty of the mean result could then be set at 3.0% in this specific case. This type of calculation and the associated illustrations are valuable tools for defining, in the analytical procedure, the result that will be reported to be compared to specifications.
3. Conclusion
The “Replicate strategy” described in the draft chapter <1220> published in Pharmacopeial Forum[1] is a tool for making results generated in the laboratory reliable and for reducing the risk of the occurrence of out of specification results which would be caused by the intrinsic variability of the method. This type of tool will be of service to manufacturers in helping to avoid investigations and will be of service to patients, as the results generated will be more reliable. Such a strategy is defined on a method by method basis.
The strategy defined must be clearly described in the method that was approved. It is therefore an integral part of the analytical procedure used to monitor the product in the laboratory.
As described in the FDA guide on OOS[4], the “Replicate strategy” which allows the mean result to be compared only with the product specifications, requires the association of a criterion representing the variability of individual results in addition to the criterion representing the mean value obtained. Only the application of both of these criteria will allow a conclusion to be reached on the compliance of the sample tested.
The second variability criterion may be based on a maximum allowed deviation (MAD) between individual values, on the RSD calculated from individual values, or again on calculation of a confidence interval. The different ways of setting such a criterion will certainly form part of future debates on the pragmatic and practical management of analytical procedures throughout the product lifecycle. In any event, this will form part of the debates of the A3P CIG on the lifecycle of analytical methods, constituted in October 2020, which will keep you up to date on the results of its discussions.
Share article


Gérald de FONTENAY – CEBIPHAR
Gérald worked in different analytical services providers and CDMOs for more than 25 years. Today, as Scientific and Technical Director at Cebiphar, he continues his quest guarantee reliable data coming from the laboratories. He brings his expertise in validation, verification, and transfer of analytical methods to the analytical projets managers and to the customers from Cebiphar, in order to conclude successfully the projects manager by Cebiphar.
gdefontenay@cebiphar.com
Glossary
QbD Analytical Quality by Design
RSD Relative Standard Deviation
RSDr Repeatability RSD = CVr (Coefficient of Variation)
RSDip Intermediate precision RSD = CVip
ICH International Council for Harmonisation of Technical Requirements for Pharmaceuticals for Human Use
OOS “Out of Specifications” Result outside acceptance criterion.
USP United States Pharmacopeia
References
[1] USP <1220> Analytical Procedure Life Cycle. Pharmacopeial Forum 46(5) (2020)
[2] T. Schofield, E. van den Heuvel, J. Weitzel, D. Lansky, P. Borman. Distinguishing the analytical method from the analytical procedure to support the USP Analytical Procedure Life Cycle Paradigm. Stimuli to the revision process. Pharmacopeial Forum 46(2) (2020)
[3] K.L. Barnett, P.L. McGregor, G.P. Martin, D.J. LeBlond, M.L.J Weitzel, J. Ermer, S. Walfish, P. Nethercote, G.S. Gratzl, E. Kovacs. Analytical Target Profile: Structure and Application throughout the Analytical Lifecycle. Pharmacopeial Forum 42(5) (2016)
[4] Investigating Out-of-Specification (OOS). Test Results for Pharmaceutical Production. Guidance for Industry. FDA (2006)
