


Sommaire
- Considerations for Validating Aseptic Manufacturing Processes.
- Simulation des procédés de fabrication aseptique de suspensions de nanoparticules ou microsphères : Challenges & facteurs de succès au travers d’un retour d’expérience.
- L’isolateur jetable pour le remplissage aseptique, innovation ou hérésie ?
- A3P/AFI Survey on Sampling & Testing Practices for In-Process Pre-Filtration Bioburden for Sterile Products: Presentation of the Results & Critical Discussion.
- Projet de norme internationale amené à être amendé PR ISO 11737-3 : Stérilisation des produits de santé - Méthodes microbiologiques - Partie 3 : essai des endotoxines bactériennes.
- Real-time detection of CFU growth with the ScanStation® smart incubator expedites the environmental monitoring process.
- MTP: What It Is, Why It Matters. Module type package standard is a major step forward for plug-and-produce manufacturing.
- How Pemflow / D.O.C. manage Extractables and Leachables Qualification of the in-process materials and primary packaging.
Real-time detection of CFU growth with the ScanStation® smart incubator expedites the environmental monitoring process.
In a time when an increasing number of laboratories are turning to rapid methods for their analysis, the responsibility is often on the end- user to validate an alternative method (eg. PCR, mass spectrometry) against the traditional, manually counted sample-on-agar cultures. INTERSCIENCE developed the ScanStation® (ISS) in the aim of providing advanced results, while still utilizing the traditional method (approved by the European Pharmacopoeia and the FDA).

This system is an innovation based on the technology of end-point colony counters that have been used in labs for over forty years1,2. By placing such a device inside of the incubation chamber, and automating the reading process, the culture growth monitoring in real time is now possible.
The ScanStation® collects images of each sample every 30 or 60 minutes during the whole duration of the incubation period. Those images, once analyzed by the monitoring software, are used to display a curve of the bacterial growth kinetics, available to the user in real-time. An example of this reporting is presented in Figure 0.
Real-time monitoring of bacterial and fungal growth affords a number of advantages beyond the advanced detection of colonies: switching from end-point to real time counting also increases the accuracy of the enumeration. Firstly, the use of a “T0” image captured at the beginning of the incubation and effectively used as a “tare” for all subsequent counts reduces the number of false positives in case of debris/particles in the matrix, or writings on the plate, which are often falsely counted as CFUs during end-point enumeration (manual or automatic). Secondly, the detection and marking of colonies as soon as they appear on the Petri dish means that subsequent overgrowth or confluent growth are less likely to lead to false negatives. The aim of this study is three-fold. First, we wish to assess the performance of the ISS by comparing the real manual with the automatic enumeration of pure cultures of the five organisms commonly tested for environmental monitoring in the pharmaceutical sector (Staphylococcus aureus, Escherichia coli, Pseudomonas aeruginosa, Candida albicans and Aspergillus brasiliensis). Here it is important to note that, in order to avoid any inter- and intra-operator variation, which is very common with end-point counting3,4, we are comparing the automatic ISS counts to a manual count based not on the traditional reading of the plates at the end of the incubation, but rather on the timelapse created by all the images collected during incubation. In a similar fashion as with replay footage in sports, the operator has access to a “back in time” function that should allow them to avoid any false positives and negatives. We will call this measure “true count”.
Second, we also sought to model the “Time to Result” for these five of the pharmacopeial test strains, as defined as the duration of incubation at which the ISS can provide a stable and reliable Colony Forming Unit (CFU) count for 85% of the samples of each strain.
Third, we tested the ISS performance in real condition by performing air environmental monitoring. The correlation of the automatic count and true count, and the ‘’Time to Result’’ were also analyzed for this purpose.
1. Methods
Context
- The following five organisms commonly tested for environmental monitoring in the pharmaceutical sector were selected and studied at the INTERSCIENCE factory site, for a total of 114 samples:
Staphylococcus aureus (ATCC 6538) - Escherichia coli (ATCC 8739)
- Pseudomonas aeruginosa (ATCC 9027)
- Candida albicans (ATCC 10231)
- Aspergillus brasiliensis (ATCC 16404)
Protocol
Inoculation of samples
90 mm TSA plates: 100μL of S. aureus, P. aeruginosa, C. albicans and A. brasiliensis suspension were inoculated on a standard 90mm Petri dishes pre-filled with Tryptic Soy Agar (TSA) with an automatic spread plater and loaded them in the ScanStation® to start incubation.
Contact plates: 100μL of E. coli suspension was inoculated on 60 mm contact plates pre-filled with tryptic soy agar with an automatic spread plater and loaded in the ScanStation® to start incubation.
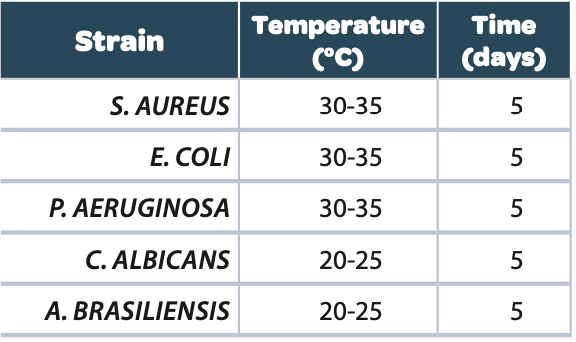
For the air environmental monitoring, 122 Petri dishes from different pharmaceutical industry laboratories were collected after inoculation of microorganisms present in the atmosphere by a passive sedimentation or using air sampler. These plates were incubated in the ScanStation® at 30-35°C for bacterial enumeration and then at 20-25°C for yeasts and molds for a total incubation time of 5 to 7 days.
Incubation
All the samples for each strain were incubated at the temperature and for the time listed in the table below:
During these five days, the Petri dish of each sample was taken in photo every 30 minutes. These images were then processed by the ScanStation® software version v1.30, which detected the apparition time of each colony and yielded a kinetics curve for each sample.
2. Results
1. Manual vs. ScanStation® enumeration comparison
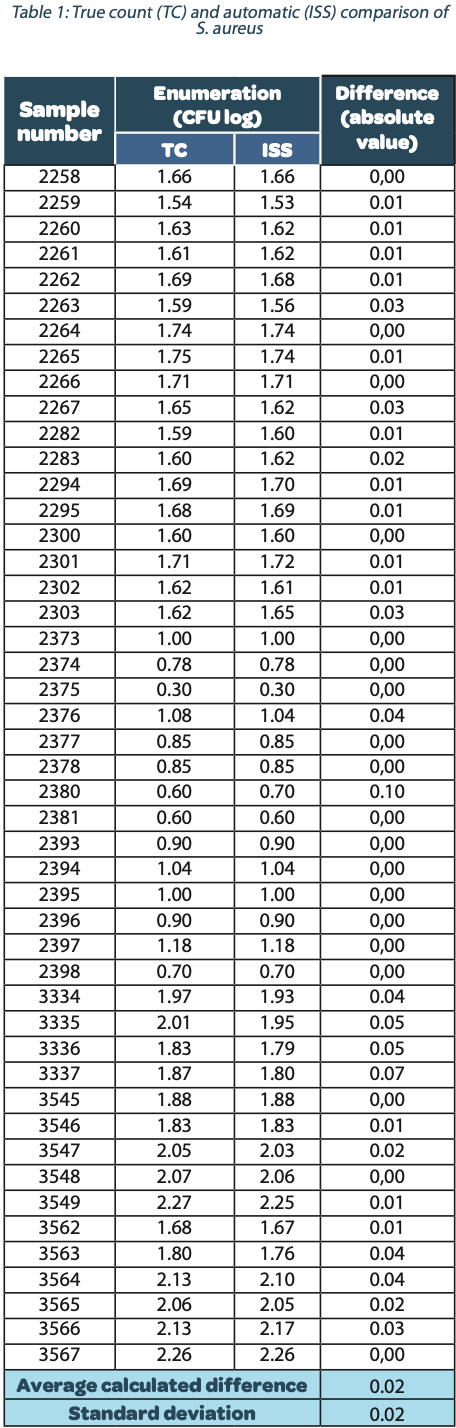
The following tables show the automatic and true count readings of the five pharmacopeial test strain colonies after growth. The manual readings were performed by manually counting CFUs on the unmarked timelapse of the growth as they appeared, therefore improving upon traditional end-point manual counting. Indeed, possible colonies hidden by an overlap in growth could be missed during classical readings on the Petri dish. This is the reason why the manual readings are qualified as “true count” in this study. All reading values are reported in the counted Colony Forming Unit (CFU) log. The difference between the automatic and real manual readings has been calculated and the average and the standard deviation per strain are given as follows:
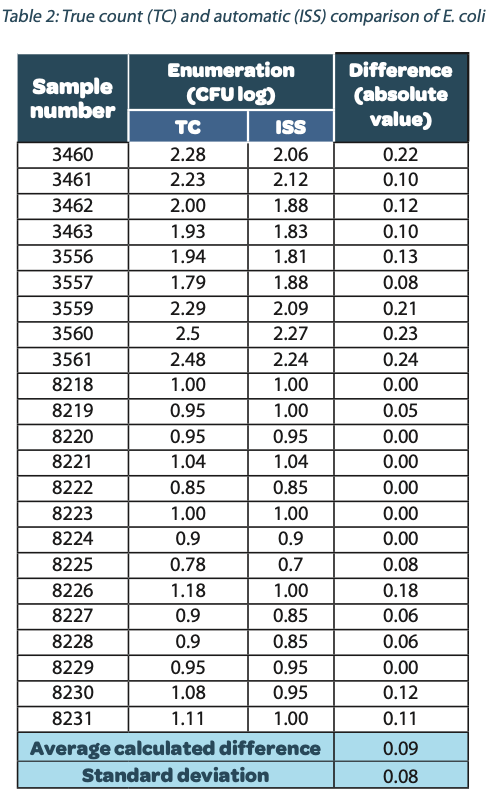 | 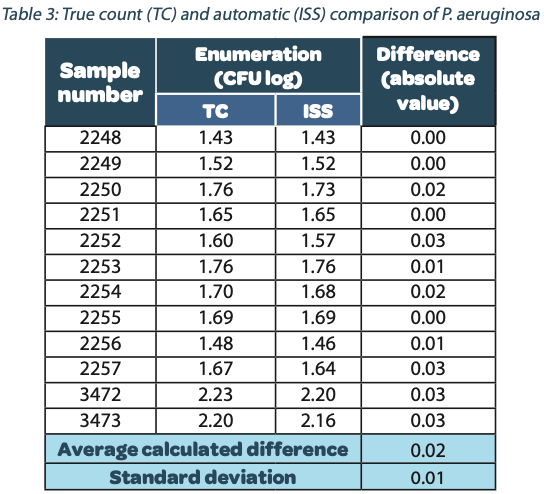 | 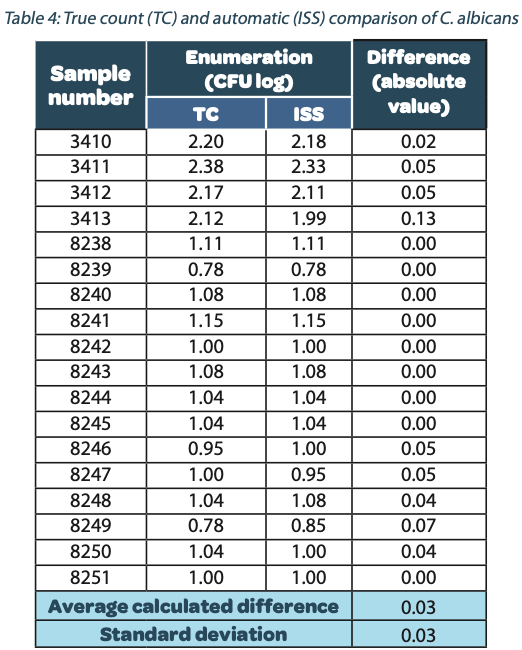 | 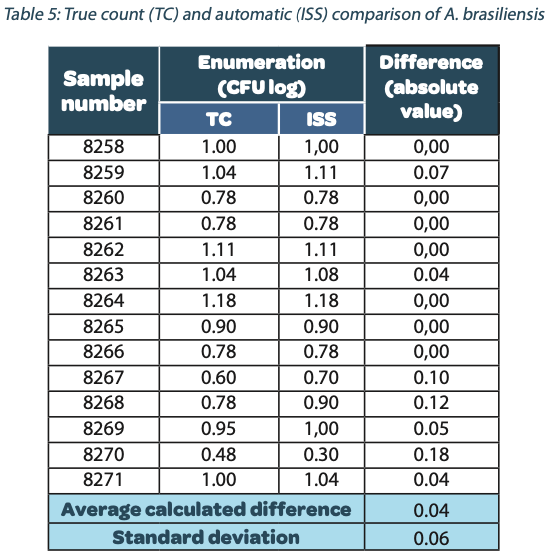 |
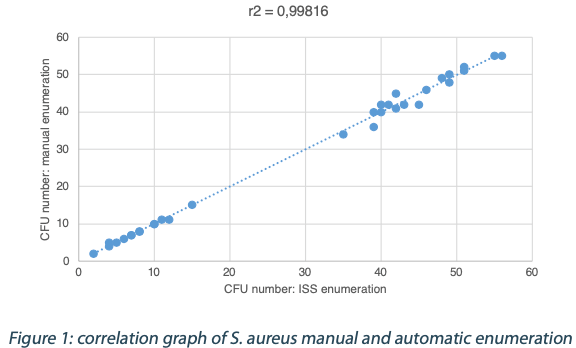
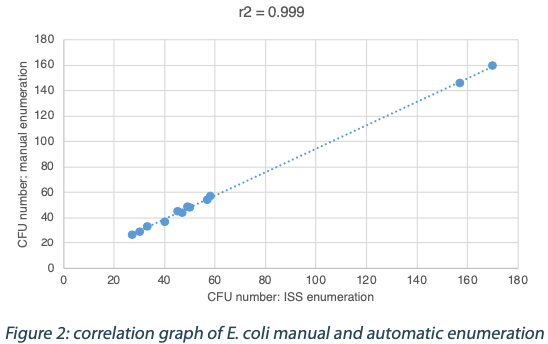
The calculated difference for all of the samples is close to 0 with a maximum of 0.24 and with a total average of all calculated differences equal to 0.04 and a standard deviation equal to 0.05. These results do not show a significant difference between the two enumeration modes. Furthermore, the following graph shows the correlation summarizing all manual and ScanStation® enumerations performed with these five pharmacopeial test strains.
 |  |
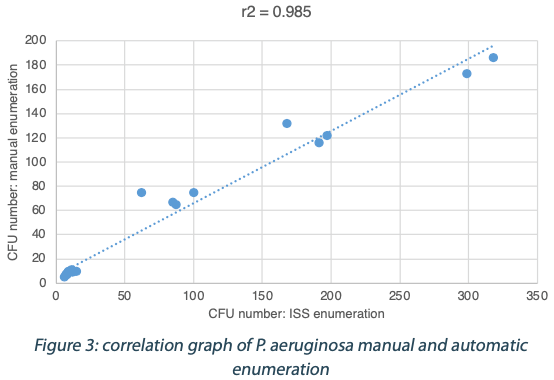 | 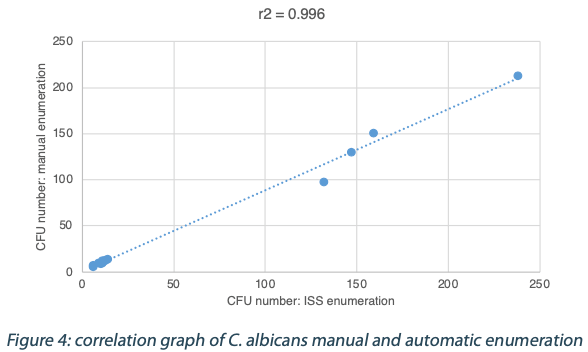 | 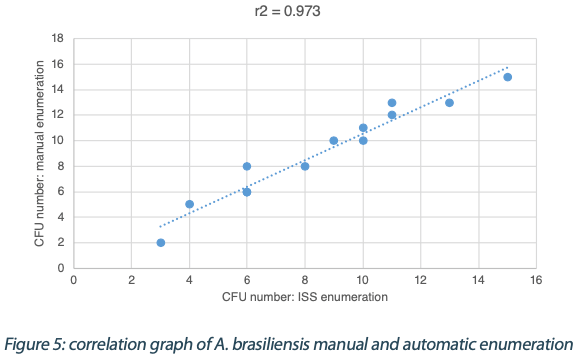 |
The correlation coefficients R2 are between 0.973 and 0.999, meaning there is not significant variation between true count and ScanStation® enumeration.
2. Time to Result
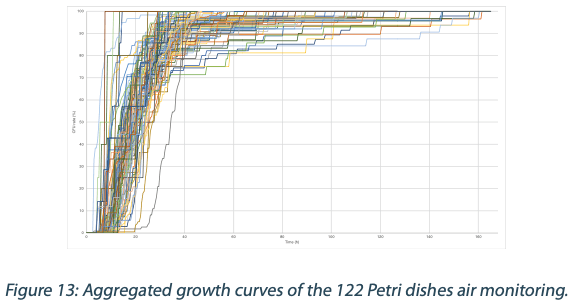
The ScanStation® captured an image of each sample every 30 minutes. These images were then processed by the ScanStation® counting software version v1.30, which detected the apparition time of each colony and yielded a kinetics curve for each sample. We aggregated those growth curves for each strain using Excel.
Figures 6 to 10 below show the aggregated growth curves for each of the five organisms tested in this study. The curves were normalized as a percentage of the total count for each sample for comparison purposes.
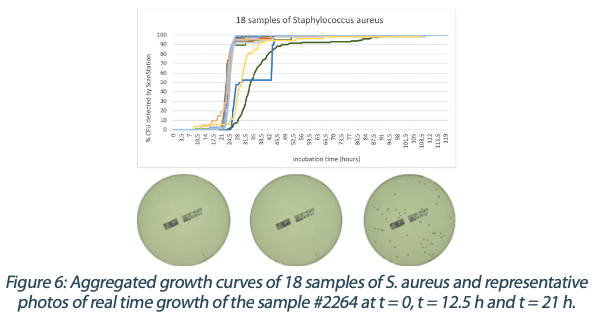 | 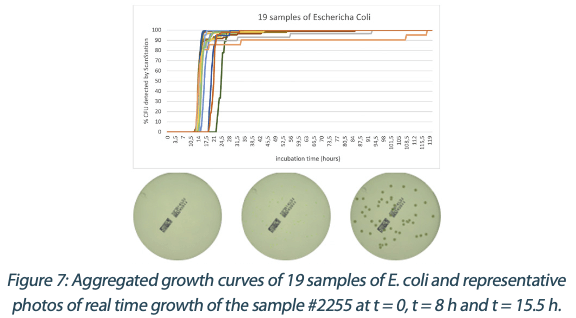 | 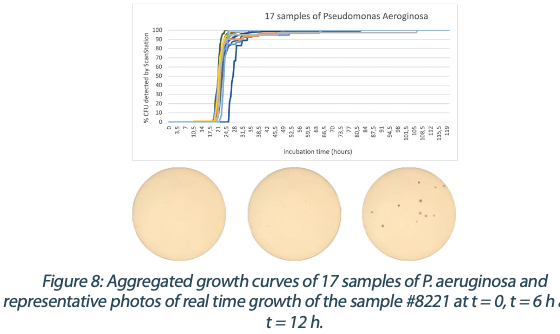 | 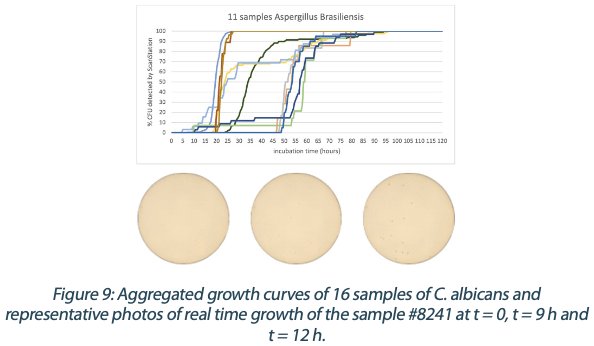 |
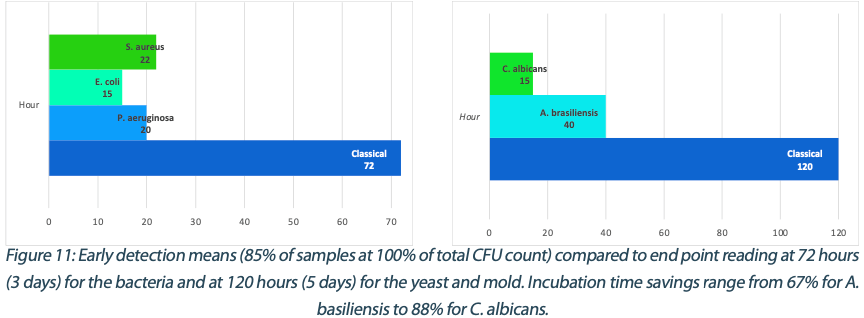
Switching to real-time analysis of bacterial growth means that the user can anticipate the total number of Colony Forming Units (CFUs) on a Petri dish as soon as the growth curve has reached a plateau. In our study, we compared the early detection mean (defined as the incubation time when 85% of samples give a stable and accurate CFU count) to the classical 3 to 5 days (72 – 120 hours) recommended for environmental monitoring in the pharmaceutical industry5, where the CFU number is recorded at the end of the incubation. We conservatively compared each of these early detection means to a 3-day and a 5-day incubation and found that real-time analysis with the ScanStation® could save 67% to 88% of incubation time compared to end-point reading. These results are detailed in Figure 11.
3. ScanStation® performance evaluation in real environmental monitoring condition
3.1. Manual vs. ScanStation® enumeration comparison
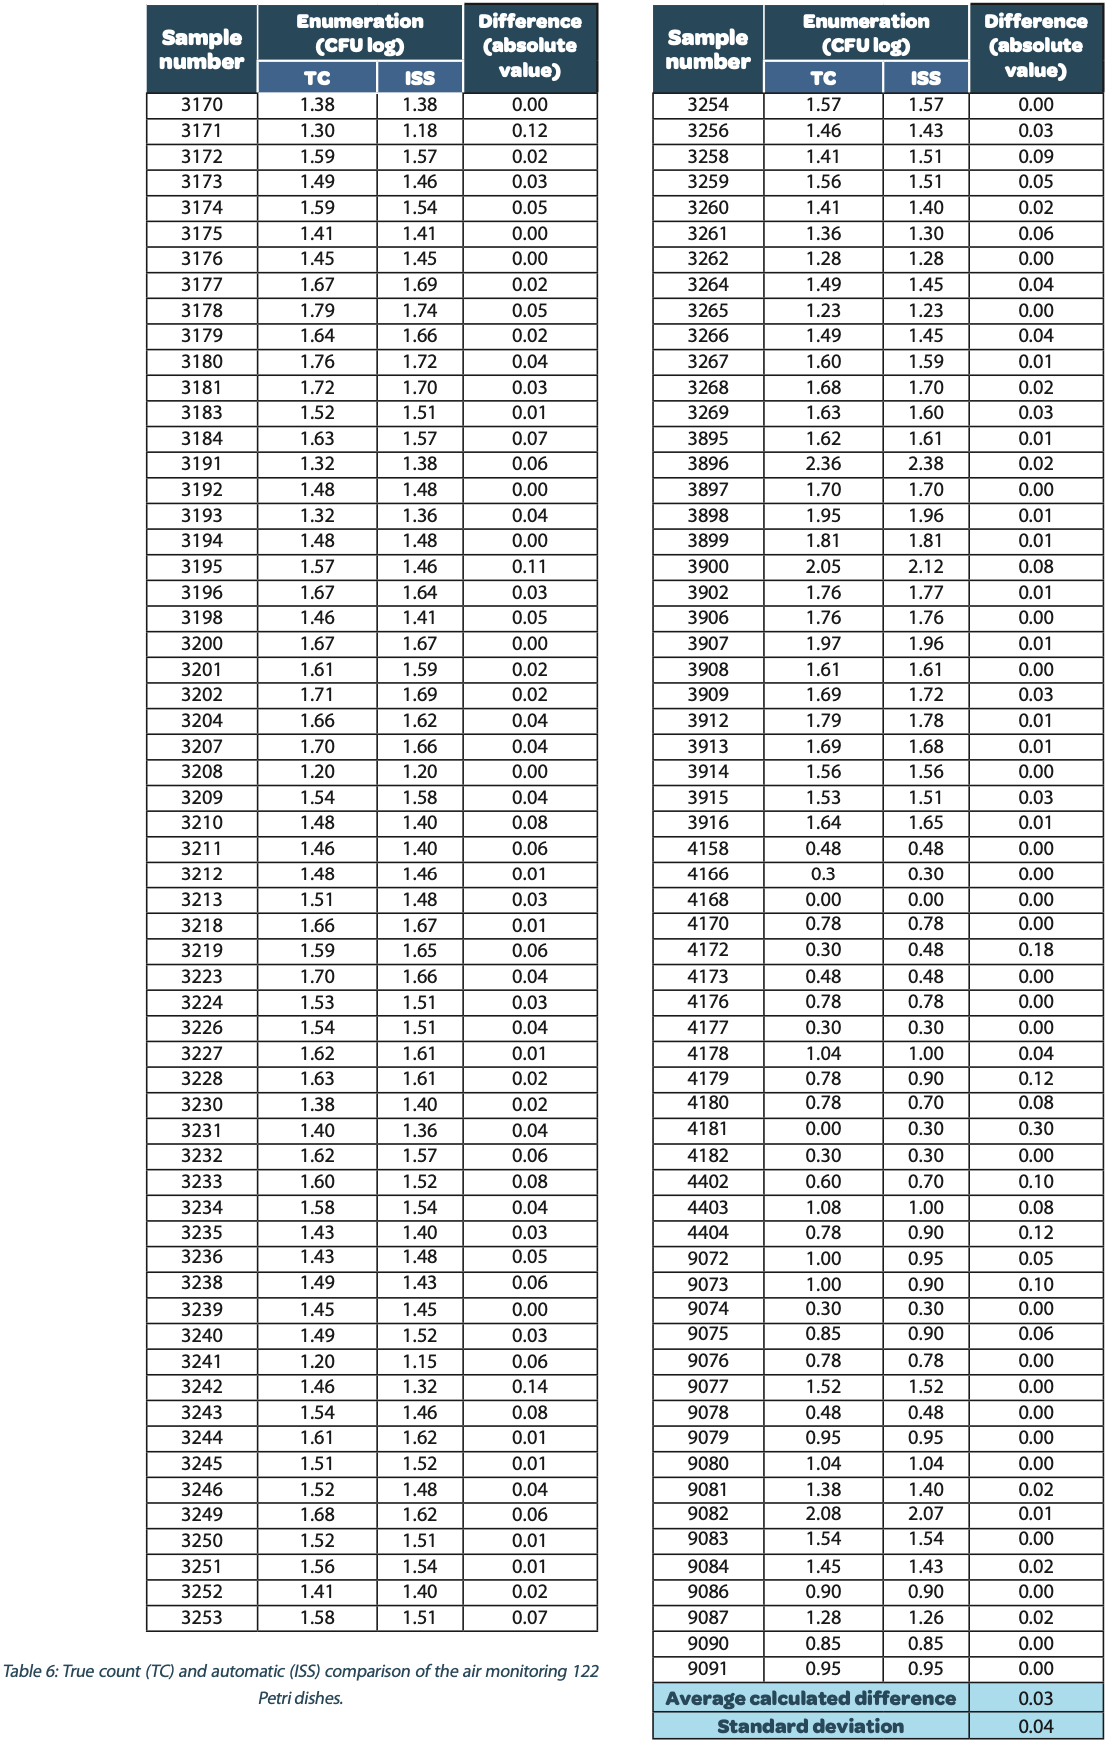
The same method than for the pure culture enumerations presented in paragraph 1 was used for the enumeration comparison of the environmental monitoring by air sedimentation or by air sampler on Petri dishes. The following table shows the automatic and true count readings of the 122 Petri dishes after microbial growth. The difference between the automatic and real manual readings has been calculated and the average and the standard deviation are given as follows:
The calculated difference for all of the samples is close to 0 with a maximum of 0.30 and with a total average of all calculated differences equal to 0.03 and a standard deviation equal to 0.04. These results do not show a significant difference between the two enumeration modes. Furthermore, the following graph shows the correlation summarizing all manual and ScanStation® enumerations performed with these 122 Petri dishes:
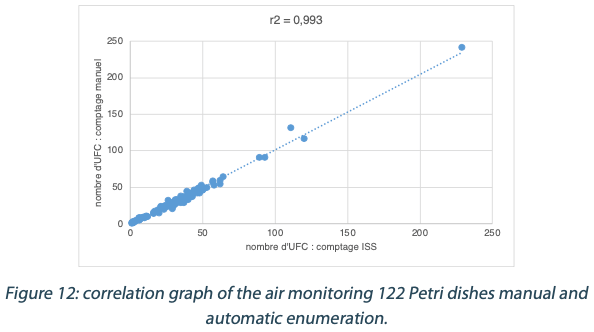
The correlation coefficient R2 is equal to 0.993, meaning there is not significant variation between true count and ScanStation® enumeration.
3.2. Time to result
The graphs of real time growth have also been performed for each sample. A time to result (TTR) has been implemented when the CFU value reached 85% of the final result.
The time of first detection varies from 3h to 16h with an average equal to 8.3 h ± 1.9. Furthermore, 85% of result is reached after an average time of 35.2 h ± 10.1. This large range of values is explained by the intrinsic conditions of the plated samples. Indeed, these samples were analyzed following real laboratory conditions and therefore suffered from different stress conditions with a different impact on microbial growth. However, TTR reading still allows a result anticipation and therefore it gives the possibility to the user to define in advance a corrective action, if necessary.
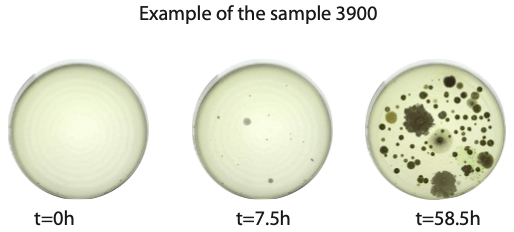
3.3. Representative photos of a real time air monitoring on TSA medium
4. Discussion
The ScanStation® performs the enumeration of a sample by detecting the dynamic formation of each colony. This method yields counts that are as close as possible to the real number of colonies on the plate. Indeed, the possibility to monitor the colony growth in real time prevents the missing of overlapped colonies that would have happened with a classical automatic end-point colony counter, or manually (false negative). Furthermore, the T0 picture of the plate taken as it is loaded into the ScanStation® and before any growth starts is used as a tare reference for the analysis. Therefore, this first picture allows the possibility to remove all initial particles (bubbles in agar, solid fragments from sample…) that could be present on the plate, and to take into account only the dynamic apparition of colonies, thus reducing false positives.
In this study, the “true count” was performed by an operator who analyzed the video generated by the ScanStation® software. In a similar manner to the ScanStation® which prevents false positive or false negative counts better than an end point colony counter, this operator provided count results that are closer to the real colony number than a classical plate reading. This is the reason why the true count was selected as the best method in this study for the comparison of the ScanStation® enumeration performance.
The comparison of ScanStation® and true count enumerations of five of the pharmacopeial test strains shows a strong correlation. Indeed, the correlation coefficient R2 is very close to 1 for all the five tested strains (figures 1 to 5). This result demonstrates that the ScanStation® enumeration method is accurate and reliable. Therefore, the ScanStation® is a relevant equipment which can be integrated in the quality control laboratory of a pharmaceutical production company. Indeed, the raw material and/or the end product control is a critical step of the pharmaceutical production because it ensures the safety and the quality of the medical product as directed by the FDA 21CFR211.84 and ICH Q76,7. The quality control consists in monitoring the eventual microbiological contaminant present in the raw material, and to determine whether the end product falls within a very strict limit for that bacterial load. Thus, the ScanStation® can perform this monitoring in real time and if the threshold is reached, an anticipated alert could be engaged, allowing an accurate stock management.
The real time colony growth monitoring by the ScanStation® highlights the three phases of microorganism growth. The first phase is the lag phase where the colonies are not visible yet, followed by the short log phase where the colony number increases rapidly, and finally the stationary phase where no more colony number variation is observed; after that comes the death phase where the number of colonies decreases exponentially8. These three first phases are modelized in Figure 0. The pharmacopoeia directives9 impose a minimum of five days of incubation to give a conform result of microbiological culture. These five days ensure the possibility to reach the stationary phase without missing any colony. The time to result from study of five of the pharmacopeial test strains and the air environmental monitoring in the ScanStation® shows that the stationary phase is actually
reached a long time before these recommended five days. This result demonstrates that the ScanStation® can be used for environmental monitoring and bioburden analysis to provide, after a validation, an anticipated result confirming that a cleanroom is under a controlled environment and fits for pharmaceutical production. Furthermore, in the case of a contamination, the ScanStation® also provides an early detection of the contaminant, giving the opportunity to engage an anticipated alert. Taking the example of E. coli performed in this study (figure 9, table 6), the early detection average occurs after 40 hours of incubation. It means that a contaminant could be detected 105 hours before the classical method recommended by the pharmacopoeia directives. Therefore, if it is necessary, the production could be stopped significatively earlier, which would in turn reduce manufacturing disruption costs10.
5. Conclusion
In light of the results discussed in this study, which show a significantly high correlation between the ScanStation® automatic CFU count and the “true count” as verified by a human operator with all the pictures taken during the incubation cycle. Furthermore, the Time to Result study gives us insights into the growth kinetics of each of the five main pharmacopeial strains which can be used, if replicated and validated in the lab where it would be intended to be installed, to shorten the detection time for environmental monitoring and therefore reduce production costs in the pharmaceutical industry.
Partager l’article

Références
1. Evaluation of Electronic Colony Counters. M. G. Fleming and F. O’Connor; Irish Journal of Agricultural Research Vol. 14, No. 1 (Apr., 1975), pp. 21-26. DOI: 10.2307/25555750
2. Predictors of bacterial resistance using in vitro dynamic models: area under the concentration–time curve related to either the minimum inhibitory or mutant prevention antibiotic concentration. Elena N. Strukova, Yury A. Portnoy, Stephen H. Zinner, Alexander A. Firsov; Journal of Antimicrobial Chemotherapy, Vol. 71, No. 3 (Mar., 2016), pp. 678–684. DOI:10.1093/jac/dkv387
3. Current practices and Prospects for Standardization of the Hematopoietic Colony- Forming- Unit (CFU) assay: A Report by the Cellular Therapy Team of the Biomedical Excellence for Safer Transfusion (BEST) Collaborative. Derwood Pamphilon, Eileen Selogie, David McKenna, Jose Cancelas-Peres, Zbigniew M. Szczepiorkowski, Ron Sacher, John McMannis, Hermann Eichler, Henk Garritsen, Minoko Takanashi, Leo van de Watering, David Stroncek, and Jo-Anna Reems; Cytotherapy, Vol. 15, No. 3 (Mar., 2013), pp. 255-262. DOI: 10.1016/j.jcyt.2012.11.013
4. Assessment of measurement uncertainty for quantitative methods of analysis: Comparative assessment of the precision (uncertainty) of bacterial colony counts. Basil Jarvis, Alan J. Hedges, Janet E. L. Corry; International Journal of Food Microbiology, Vol. 116, No. 1 (May 2007), pp. 44-51. DOI: 10.1016/j.ijfoodmicro.2006.12.037
5. Pharmaceutical Microbiology Manual, 2015 https://www.fda.gov/files/about%20fda/publis hed/Pharmaceutical- Microbiology-Manual.pdf accessed 02SEP20
6. FDA Code of Federal Regulations 21CFR211.84, Revised 2019. https://www.accessdata.fda. gov/scripts/cdrh/ cfdocs%20/cfcfr/CFRSearch.cfm?fr=211.84 accessed 02SEP20
7. ICH Q7 Good manufacturing practice for active pharmaceutical ingredients, 2016 https:// www.fda.gov/files/drugs/published/Q7- Good-Manufacturing-Practice-Guidance-for- Active-Pharmaceutical-Ingredients-Guidancefor- Industry.pdf accessed 02SEP20
8.”Bacterial Growth Curve”, revised 2004. Fankhauser, David B. University of Cincinnati Clermont College. https://web.archive.org/web/20160213221827 /http://biology.clc.uc.edu/Fankhauser/Labs/ Mi crobiology/Growth_Curve/Growth_Curve.htm accessed 02SEP20
9. European Pharmacopoeia (Ph. Eur.) 10th Edition 10. Bai, Ge, et al. “THE COST OF MANUFACTURING DISRUPTIONS.” Strategic Finance, sfmagazine.com/postentry/ december- 2015-the-cost-ofmanufacturing- disruptions/ accessed 02SEP20
