


Sommaire
- Quelques bonnes pratiques de validation des procédures analytiques
- ALCOA… avec un A pour Accuracy
- Established Conditions for Analytical Procedures and QbD: current situation and future perspectives for enhanced change management paradigm
- Quand les vibrations des molécules permettent de les doser : la spectroscopie proche infrarouge en action
- Apport des études de stabilités accélérées prédictives (APS) au développement pharmaceutique
- Mise en place de la chimie analytique verte au laboratoire contrôle qualité de la société UPSA
- Évaporation des solutions à base d’alcool : Quels résidus sur les équipements ?
ALCOA… avec un A pour Accuracy
Générer des données analytiques, c’est très facile. Il suffit de mettre en œuvre une analyse, d’obtenir une réponse, et de l’interpréter en générant un résultat chiffré. Générer un résultat fiable, qui soit représentatif du produit qu’on souhaite caractériser, et permette d’apporter des garanties sur sa Qualité, est un processus bien plus complexe. Les BPF comme tout autre système de management de la Qualité ou réglementation, exige déjà d’avoir un équipement qualifié, utilisé par un personnel formé, dans un environnement contrôlé. Les fondamentaux…

Avec cet équipement, il faudra aussi mettre en œuvre une méthode d’analyse dûment validée. Et si cet équipement inclus un système informatisé, la validation informatique sera de rigueur. L’intégrité des données occupe largement les esprits et en particulier chez les garants de l’Assurance de la Qualité. Il est en effet important de s’assurer que les données générées par un système sont exactes, complètes, et qu’elles n’ont subi aucune altération tout au long de leur cycle de vie. [2]
Bien au-delà de la qualification de l’équipement et de la validation des systèmes générant des données analytiques, il faut considérer la méthode analytique elle-même, qui est la source initiale de ces données. Cette méthode analytique a été développée pour caractériser un ou plusieurs Attributs Qualités Critiques du produit analysé, afin d’en garantir, au moins partiellement, la Qualité intrinsèque.
Durant le cycle de vie de la méthode, qui tourne en parallèle du cycle de vie du produit, la fiabilité de la mesure devra donc être connue et maîtrisée sur le long terme. Et cette fiabilité de la mesure est caractérisée, durant la validation d’une procédure analytique, à travers l’analyse séparée de l’erreur systématique (biais/ “bias”), et de l’erreur aléatoire (dispersion/ “precision”), qui peuvent être combinés par une évaluation de l’erreur totale. [3, 4] Les résultats de cette étude de validation, éventuellement complétée par des cartes de contrôles des performances de la procédure analytique, sont donc, en plus des exigences pour la constitution des dossiers d’enregistrement, les principaux garants de l’exactitude (“ACCURACY”) des données générées.
Un des 2 A de ALCOA (A comme “ACCURACY”) est donc dépendant, en tout premier lieu, de la fiabilité des mesures générées, et doit mettre en avant l’importance de la validité des données, garanties par une validation de méthode et par des garde-fous quotidiens (SST : System Suitability Test ou “tests de conformité” en Français) pour éviter toute dérive de l’équipement ou de l’analyste durant la mise en œuvre de la procédure analytique.
1. Qu’est-ce que l’intégrité des données ?
La MHRA (Medicines and Healthcare Products and Regulatory Agency), définit dans son guide paru en 2018 “GxP Data Integrity Guidance and Definitions” [2] l’intégrité comme étant l’assurance que les données produites par un système sont exactes, complètes et qu’elles n’ont subi aucune altération tout au long de leur CYCLE DE VIE.
Pour assurer l’intégrité des données, il convient de vérifier que les données sont :
• Exactes (Accurate) – pas d’erreur ou correction sans modifications documentées.
• Lisibles (Legible) – facilement lues.
• Contemporaines (Contemporaneous) – documentées au moment de l’activité.
• Originales (Original) – tous les documents ou observations sont écrits et imprimés (ou copie certifiée du dit document).
• Attribuables (Attribuable) – savoir qui génère la donnée ou effectue une action sur celle-ci et quand.
• Complètes (Complete) – toutes les données sont présentes et disponibles.
• Cohérentes (Consistent) – tous les éléments de l’enregistrement, telles que la chronologie sont suivis et datés ou horodatés dans l’ordre attendu.
• Durables (Enduring) – conservées sur média de stockage approuvés (papier ou électronique).
• Disponibles (Available) – pour revue, audit ou inspection durant la durée de vie de l’enregistrement.
Ces 5 premiers termes constituent l’acronyme : ALCOA Les 4 derniers constituent le + dans l’acronyme : ALCOA +
2. Le processus analytique
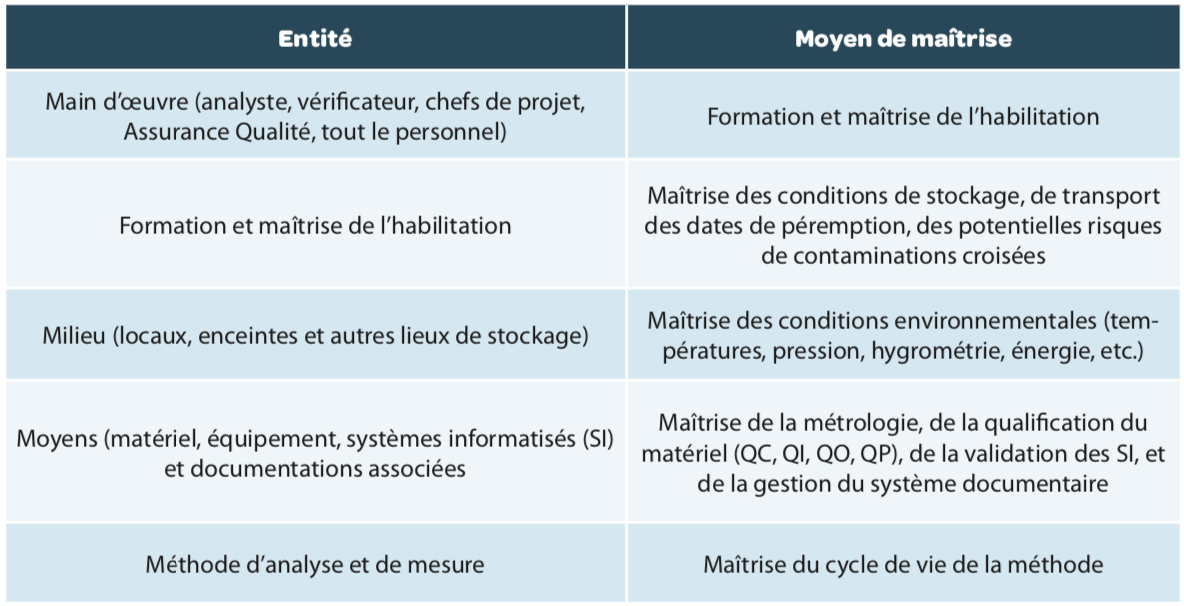
L’analyse est un processus comme un autre. La maîtrise complète de ce processus aura autant d’importance, au final, que la maîtrise du processus de fabrication. Un certificat d’analyse conforme n’est en effet que la combinaison d’une fabrication conforme et d’une analyse représentative du produit contrôlé.
Chaque entité, chaque “M” de ce process (Main d’œuvre, Matières, Milieu, Moyens et Méthodes) doit être maîtrisé (Figure 1 et Tableau 1), c’est-à-dire être conforme aux exigences prescrites dès sa mise en place, mais également dans le temps.
3. Cycle de vie de la méthode
Bien trop souvent, la maîtrise d’une méthode se limite à connaître son état validé ou pas. L’édition récente dans Pharmacopeial Forum du draft de l’USP <1220> [5] aura permis d’ouvrir les yeux sur l’importance de toutes les autres étapes de ce cycle de vie, déjà mise en avant dans le guide FDA sur les validations en 2015. [6]
• Un développement analytique complet, permettant de connaître les forces et les faiblesses de la méthode utilisée, de diminuer autant que possible toutes les sources de variation potentielles (comme décrit dans l’article précédent sur “Quelques bonnes pratiques de validation” dans cette même revue) et d’en définir les conditions d’application à travers une étude de robustesse menée en amont de la validation
• Une validation de la méthode dans les conditions prédéfinies durant le développement, avec une analyse approfondie de la réelle fiabilité des mesures générées par la procédure analytique.
• Une surveillance de la procédure analytique, avec des SST (System Suitability Test) spécifiquement définis pour la méthode employée, permettant d’éviter ou d’identifier toute erreur de l’analyste ou toute dérive de la méthode ou de l’instrument permettant de générer ces données.
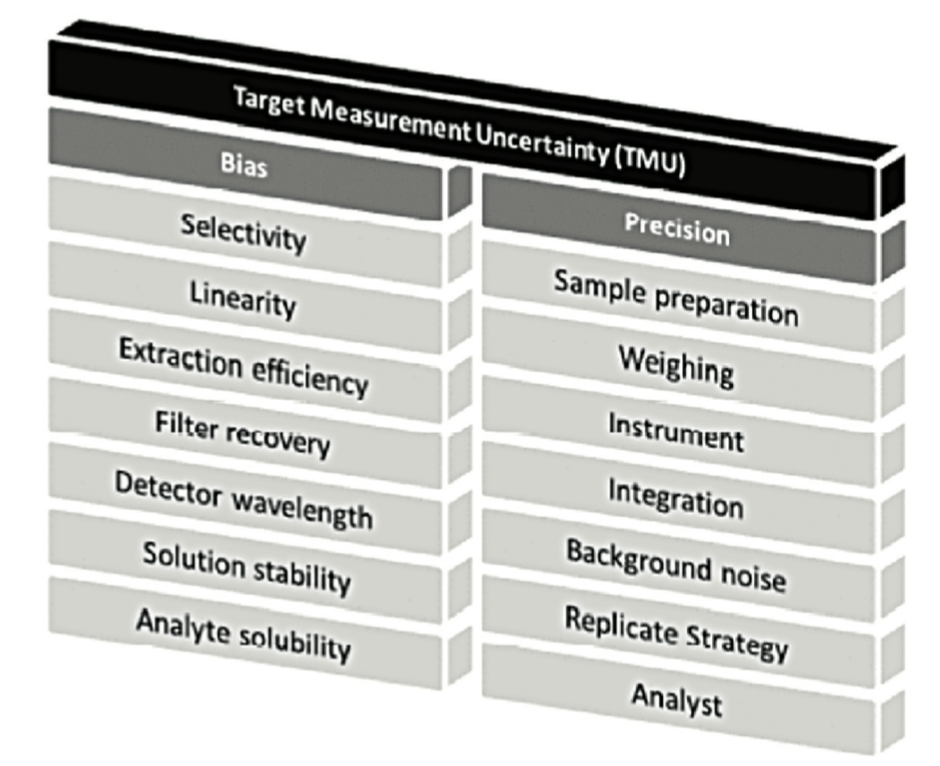
Au cœur de ce cycle de vie, la validation de la méthode reste toutefois une étape importante. Dans une version antérieure du chapitre <1220>, la notion de TMU = Target Measurement Uncertainty était représentée par un “temple” avec 2 piliers majeurs : «Bias” et “Precision”, comme illustré sur Figure 2.
La “Target Measurement Uncertainty” (incertitude maximale ciblé) peut être fixé comme objectif en amont du développement de la méthode.
Les développeurs s’assureront donc que la somme des différentes sources d’erreur (erreur systématique (“Bias”) et erreur aléatoire (“Precision”)) n’impacteront pas trop la fiabilité de la mesure. Pour cela, certains facteurs seront fixés de façon stricte pour minimiser leur potentiel impact.
En validation, l’objectif principal sera de mesurer l’erreur résiduelle, celle qu’on ne peut pas éviter.
L’erreur systématique résiduelle sera estimée durant l’étude dénommée Accuracy dans ICH Q2(R1) [7] (le terme adéquat étant justesse (“Trueness” en Anglais). L’étude de l’erreur aléatoire résiduelle sera estimée durant l’étude de la fidélité (répétabilité, fidélité intermédiaire). Et la combinaison de ces 2 sources d’erreur, sous forme de l’analyse de l’Erreur Totale ou erreur combinée, [3, 4] permettra de réellement appréhender l’incertitude de chaque mesure individuelle, comme décrit dans la section suivante de cet article.
Une étape ultime sera de définir ce que sera le résultat rapporté dans les certificats d’analyse (“reportable result”). Ce résultat rapporté peut être une mesure individuelle ou la moyenne de plusieurs mesures obtenue selon une stratégie justifiée et documentée, comme déjà décrit dans la Vague n°68 (article “Replicate strategy”).[8]
4. Les “pourquoi” de la validation
Pourquoi valide-t-on nos procédures analytiques ?
Si beaucoup des questions posées ci-dessous paraissent simplistes ou répétitives, il reste important de garder les réponses en tête. Et surtout de ne pas s’arrêter après le premier “pourquoi”…
Pourquoi N°1. Exigences réglementaires
Utiliser des méthodes d’analyse validées est une exigence des autorités de santé. Quel que soit le texte de référence (BPF [1], USP [9], ICH Q2R1 et bientôt Q14 ou autre), tous sont unanimes : les méthodes d’analyses utilisées doivent être validées avant leur utilisation en routine, et telles qu’elles seront utilisées en routine.
En d’autres termes, valider ses méthodes de contrôle et mesure sert donc à démontrer aux autorités, via des preuves tangibles et objectives, que les techniques développées répondent à la fois aux besoins et aux exigences pour lesquelles elles ont été développées et qu’elles donnent des résultats fiables et intègres.
Pourquoi N°2. Démontrer sa capacité à mesurer
Une méthode d’analyse, aussi performante soit-elle, est nécessairement entachée d’une erreur. Tous les statisticiens vous le diront : on ne peut jamais connaître avec certitude la valeur vraie caractéristique d’un produit ou d’un procédé mais uniquement s’en approcher. Tout est une question d’erreur et de probabilité, qui peut se résumer en un mot “incertitude” .
Valider une méthode, d’un point de vue statistique, revient à évaluer l’erreur totale inhérente à cette dernière et à la comparer à des critères d’acceptation que l’on peut considérer comme une erreur acceptable. Par erreur totale d’une méthode analytique on entend la somme de l’erreur systématique ou biais de la méthode et de l’erreur aléatoire ou fidélité de la méthode, qui sont explicités, séparément, dans l’article précédent de cette revue (“Quelques bonnes pratiques de validation des procédures analytiques”). Valider une méthode c’est aussi estimer la probabilité que, quel que soit le jour, l’heure, le technicien, l’équipement, le lot de réactif, … utilisés pour conduire l’analyse, les résultats obtenus seront assez proches de la valeur réelle qui, elle, restera inconnue. En résumé, valider une méthode analytique revient à démontrer une capacité à mesurer, quantifier, qualifier, caractériser de façon fiable et sécurisée.
Pourquoi N°3. Garantir l’intégrité des données
En validant leurs méthodes d’analyse, les laboratoires évaluent leur justesse et , leur fidélité. ; par cet exercice, ils vérifient également que les données générées sont exactes et cohérentes, attribuables à un échantillon donné, lisibles, …
Valider les méthodes d’analyse permet donc aux laboratoires de répondre en partie à une seconde exigence des autorités de santé : celle de garantir, au moins partiellement, l’intégrité de leurs données, en accord avec les définitions fournies en section 1 de cet article.
NB : La validation est une étape essentielle mais ne suffit pas – l’intégrité des données demande d’autres éléments tels que la sécurisation de la donnée qui passe entre autres par la validation des systèmes d’information utilisés pour les générer, traiter, stocker, archiver…
Pourquoi N°4. Réduire les risques de nos prises de décisions
Aujourd’hui nous disposons d’une multitude d’informations : nous mesurons, collectons, enregistrons, stockons, analysons tout un tas de données. Mais dans quel but ? Toujours le même : réduire les risques liés à nos prises de décisions.
Dans le cadre des industries de santé, ces prises de décisions sont pour certaines critiques car susceptibles d’avoir un impact direct sur la santé d’un patient. Il est donc essentiel que les données sur lesquelles s’appuient ces décisions soient complètes, fiables et sûres ; en d’autres termes qu’elles soient intègres.
En réalisant des validations de méthode et évaluant l’erreur totale de leurs méthodes d’analyse, les laboratoires viennent renforcer la confiance dans les données sur lesquelles ils s’appuieront pour prendre des décisions, telles que des libérations de lots.
Pourquoi N°5. Répondre aux objectifs des autorités de santé
Garantir l’efficacité, la pureté et la qualité des produits fabriqués, au travers d’une analyse fiable.
5. Le profil d’exactitude, une réponse adaptée à ces “pourquoi”
Le profil d’exactitude est un outil statistique et graphique utile pour l’évaluation de la performance d’une procédure analytique basé sur l’erreur totale (biais + dispersion) et les principes d’intervalle de tolérance.
Le rôle du profil d’exactitude est d’estimer, à partir des résultats obtenus, quelle garantie aura l’utilisateur que la méthode utilisée en routine fournira des résultats acceptables. Il permet de simplifier l’approche de la validation d’une procédure analytique tout en contrôlant le risque associé à son utilisation. L’utilisation du profil d’exactitude (Figure 3) passe par la fixation des deux critères de décision suivants :
• Limites d’acceptabilité de la méthode. Elles servent à traduire les objectifs pratiques des utilisateurs. Elles délimitent un intervalle autour de la valeur de référence. Le plus souvent, ces limites sont réglementaires ou issues de la réglementation. Mais dans le cas où il n’existe pas de référence établie, il convient de prendre en compte les attentes des utilisateurs finaux (comme une limite de quantification donnée), et la nature des décisions à prendre à partir des résultats de mesure.
• Proportion BETA. Elle représente la proportion de futurs résultats qui seront compris dans les intervalles de tolérance. La valeur choisie pour BETA dépend largement du champ d’application (contrôle sanitaire, contrôle de fabrication, etc.). Il est évident que plus le BETA est petit, par exemple 80 %, plus la méthode risque de produire des résultats qui ne correspondent pas aux spécifications annoncées.
Depuis sa mise en place, bien que cet outil soit :
• très utile et efficace pour l’évaluation de la vraie erreur des méthodes,
• appliqué,
• et reconnus dans différents secteurs d’activité (pour tous les types de méthodes de mesure et contexte (produit ou matrice biologique …), quelques freins ou réticences ont été soulevés, auxquels on peut apporter des réponses.
- a. Quelques confusions résiduelles de terminologie dans certains secteurs d’activités entre notamment entre Justesse et exactitude, ou entre reproductibilité et fidélité intermédiaire
Alors que les définitions étaient claires depuis 30 ans. [10]
- b. Dans certains laboratoires, l’erreur totale gène dans la mesure où le profil d’exactitude montre une erreur plus grande qu’avant …
Oui mais avant ce n’était pas tout à fait la vraie erreur de la méthode et la validation n’est pas uniquement une histoire de tests statistiques. Pour rappel, avant le profil d’exactitude, les statistiques appliqués (ANOVA, STUDENT …) entrainaient les remarques suivantes dans les laboratoires : “… La statistique nous pénalise…”, “…plus nous travaillons bien, plus nous sommes pénalisés statistiquement…”, “… nous avons du mal à conclure quant à la performance globale de la méthode avec tous ces tests statistiques imbriqués ….”
- c. Pour certains, les calculs d’intervalle de tolérance étaient complexes
Mais au final l’interprétation des résultats est plus simple
- d. Résistance au changement par exemple pour les aspects dossiers réglementaires
Oui mais travailler en erreur totale n’empêche pas de proposer dans les rapports chacune des erreurs ?
- e. Pour certains, les profils ne sont pas une obligation dans les dossiers
Oui mais c’est dans les tendances AQbD, futur ICH Q14, futur USP 1220 ou existante (USP 1210, normes V03-110, T90-210, normes pour les méthodes Q-PCR …) et cela apporte des opportunités au-delà des requis actuels : c’est une réponse à un besoin de l’utilisateur qui doit comprendre, lors de la gestion d’OOS, la part potentiellement due à l’analytique et celle qui serait un problème de fabrication.
Toutefois, il faut bien rappeler que la proposition de ce profil a été introduit en 2003 dans la mesure où il avait été constaté très régulièrement que valider une méthode en “erreurs dissociées” (Biais d’un côté et dispersion de l’autre (et non la somme des 2 erreurs)) entrainaient 2 questions récurrentes :
• Comment se fait-il que nous ayons autant de difficultés à transférer cette méthode alors qu’elle avait été déclarée VALIDE (… oui mais en “erreurs dissociées”) ?
• Comment se fait-il que nous ayons autant de re-dosage /réanalyse en routine ?
La plupart des arguments “contre” sont souvent générés par la classique résistance aux changements. Les auteurs de cet article espèrent que le point 5 aidera un maximum de personnes à sauter le pas.
En effet, l’apport du profil d’exactitude permet : • D’être plus proche de la réalité
• De faciliter les transferts analytiques
• De réduire les re-dosages
• D’être dans une démarche de gestion des “RISQUES”
• De faire moins d’analyses statistiques
• De disposer d’un outil simple d’interprétation
• De mieux maîtriser la procédure analytique et son erreur
• De contribuer à l’estimation des incertitudes de mesure
• De rassurer les évaluateurs, auditeurs, inspecteurs, clients, consommateurs
Et donc au final, de participer à l’amélioration de l’intégrité des données (A de ACCURACY dans les principes ALCOA).
Sans détailler les différences entre le profil d’exactitude (avec intervalle de tolérance) expliqué ici et l’intervalle de prédiction décrit comme alternative dans le chapitre USP <1210>, il est bon de noter que les 2 démarches sont basées sur des approches similaires. L’arrivée récente dans l’USP du concept permettra de démocratiser ce type d’approche connu dans d’autres domaines scientifiques depuis plus de 30 ans.
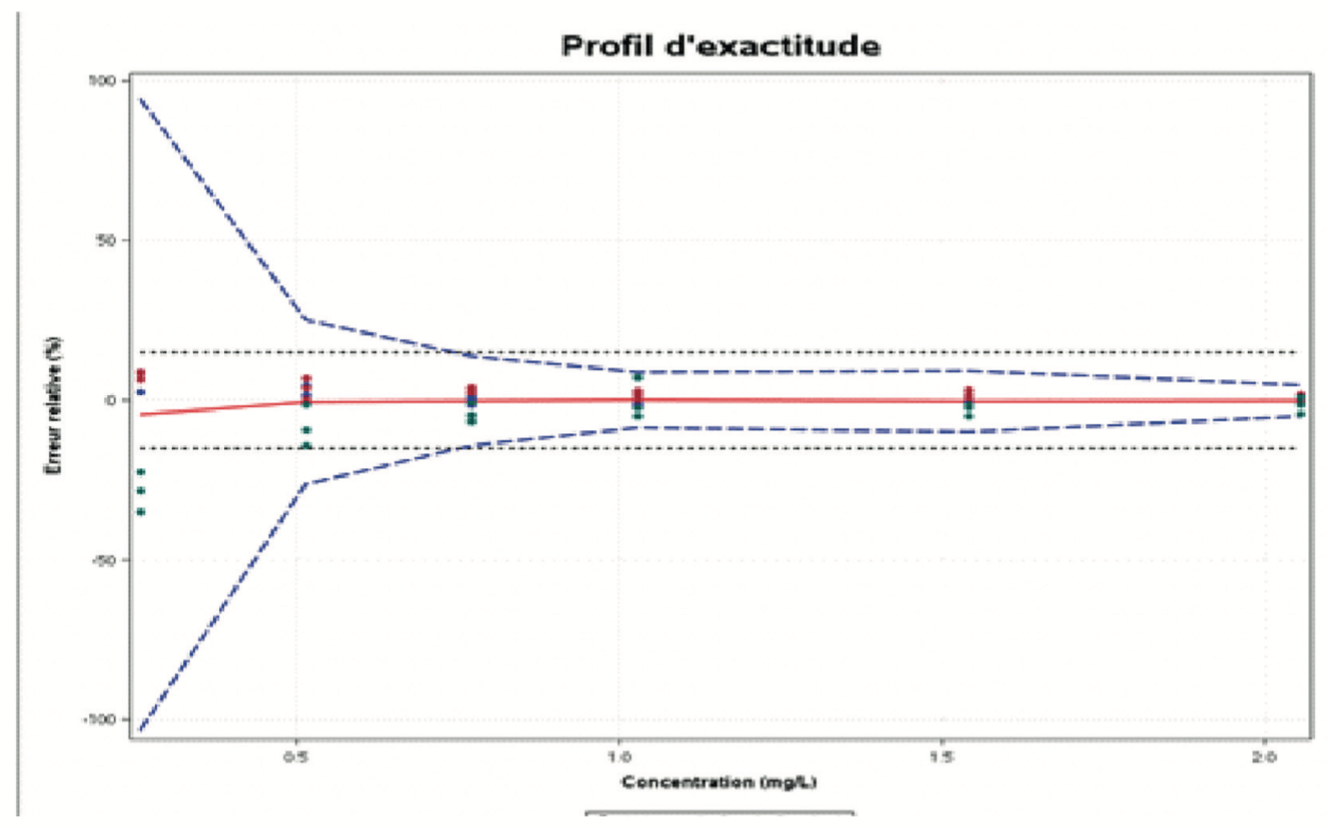
la cible, en bleu, les limites de l’intervalle de tolérance, défini à partir des données de la validation de la procédure analytique. Ces limites correspondent à l’espace dans lequel 95% des mesures qui seront réalisées avec cette procédure analytiques seront observées. A la 1ere intersection des 2 : la limite de quantification ! en effet, si on analyse à une concentration plus faible, le risque de sortir de la cible est trop important. On n’a plus la fiabilité espérée
Conclusion
Au-delà du requis réglementaire, chaque laboratoire doit se donner le maximum de garanties pour que les résultats générés soient fiables.
L’approche de “Erreur totale”, qui est représentative de l’erreur inconnue à laquelle tout analyste est confronté à chaque analyse de lot, répond à la majorité des questions qui peuvent se poser lorsqu’on aborde le rôle de la validation des procédures analytiques de façon plus large.
Et cette “erreur totale”, nommée Accuracy dans le vocable des normes ISO, est bien la même qu’un des 2 A de ALCOA. Donc, avant d’assurer les L, les C, les O, l’autre A et le + de ALCOA+, il est bon de déjà garantir l’Accuracy des données générées !
Partager l’article


Eglantine Baudrillart – Neovix Biosciences
Eglantine est Responsable Business Developement du groupe neovix biosciences. Ingénieur en génie chimique (ENSIC) et diplômée de l’Advanced Management Programme de l’EDHEC BUSINESS SCHOOL, Eglantine a débuté sa carrière au sein des Laboratoires GSK par la mise en place d’un pôle de modélisation mathématique et statistiques puis a rejoint en 2008 les Laboratoires Expansciences au poste de responsable éco-conception procédés puis a repris la direction d’un laboratoire d’analyse accrédité.

Eric Chapuzet – Qualilab
Eric est Directeur Général de QUALILAB, société spécialisée dans le conseil en management de la qualité, sur le cycle de vie de méthodes d’analyse, les systèmes d’informations, l’intégrité des données et l’analyse de données. De formation scientifique (statistique, informatique, qualité, physiologie, pharmacologie, biochimie), il participe régulièrement à des projets de validation et transfert de méthodes analytiques. Éric anime et réalise également des formations et des audits dans le cadre des étapes du cycle de vie des méthodes d’analyse depuis de nombreuses années.

Gerald de Fontenay – Cebiphar
Depuis plus de 25 ans, Gérald a assuré différents postes au sein de sociétés de services analytiques et de CDMO. Aujourd’hui Directeur Scientifique et Technique chez Cebiphar, il continue à œuvrer pour garantir le maximum de fiabilité aux résultats qui sont générés dans ses laboratoires. Il apporte son expertise en validation, vérification et transfert de méthodes analytiques auprès des chefs de projets et des clients de Cebiphar, pour assurer le succès des projets qui lui sont confiés.
gdefontenay@cebiphar.com
Marc François Heude – Siegfried
Titulaire d’un doctorat en chimie organique, Marc assure, depuis 6 ans, des rôles de chef de projets analytiques d’abord à Adocia (Société de biotechnologie Lyonnaise) puis à Bayer Healthcare. Il exerce aujourd’hui en tant que responsable du service de développement analytique chez Siegfried, un CDMO de l’industrie pharmaceutique qui produit des APIs et intermédiaires de synthèse.
Références
[1] : EudraLex – Volume 4 – Good Manufacturing Practice
(GMP) guidelines.
[2] : MHRA (Medicines and Healthcare Products and Regulatory Agency), «GxP Data Integrity Guidance and Definitions, 2018.
[3] : P. Hubert, J.-J. Nguyen-Huu, B. Boulanger, E. Chapuzet , P. Chiap, N. Cohen, P. Compagnon, W. Dewé, M. Feinberg et M. Lallier, «Validation des procédures analytiques quantitatives
harmonisation des démarches,» S.T.P. Pharma Pratiques, vol. 13, p. 101, 2003.
[4] : US Pharmacopoeia: USP <1210>.
[5] : Pharmacopeial Forum (PF), 1220 Analytical Procedure Life Cycle — PF 46(5), 2020.
[6] : FDA Guidance: “Analytical Procedures and Methods Validation for Drugs and Biologics”, 2015.
[7] : ICH Q2 (R1) “Validation of Analytical Procedures: Text and
Methodology”, 2005.
[8] : G. de Fontenay, «”Replicate Strategy” : mais quel est ce concept ?,» La Vague, vol. 68, p. 34, 2021.
[9] : US Pharmacopoeia: USP <1210>; <1225>; <1226>. [10] : NF ISO 5725. Application de la statistique. Fidélité des méthodes d’essai. Détermination de la répétabilité et de la reproductibilité d’une méthode d’essai normalisée par essais interlaboratoires., 1987.
