


Summary
- Injectable Combination Products. Issues and challenges for industry.
- Deadline Extension or Not: Key Points for Class I Manufacturers
- The new challenges of injectable medicines
- Clinical Investigation of Combined Medical Devices Under New Regulation (EU) 2017/745 (MDR)
- Contribution of the physicochemical characterization of the materials constituting medical devices for rationalisation of their biological assessment.
- Steering Cleaning Validation Performance : A Key Industrial Challenge.
- Cleaning Process Validation: Why and How to Validate Analytical Methods and Related Sampling Methods
- A Risk-Based Approach to Stainless Steel Equipment Maintenance in cGMP Manufacturing Environment
- Single Use Systems vs Re-Usable Stainless-Steel Equipment. Compliance & Quality Perspective.
Cleaning Process Validation: Why and How to Validate Analytical Methods and Related Sampling Methods
GMP Annex 15 requires that all the methods used within the framework of qualifications and validations should be validated with appropriate limits of quantification (point 9.1.).
The aim of this article is to propose a methodology for the validation of analytical methods and physicochemical sampling for use in validating cleaning processes: the objective of each test will be explained, along with the methodology to carry it out.

1. Method validation prerequisites
Before performing method validations, the following elements must be known:
- The tracer
- Its acceptance criterion
- The size and nature of the surfaces to be sampled
- The sampling methods to be used (swabbing, rinsing, nature of the sampling and dilution solvents, procedures, etc.)
The tracer will be defined beforehand according to the strategy applied in the cleaning validation project. The type of analysis method used (specific or non-specific) will be chosen according to the chemical properties of the tracer, the quantification thresholds to be attained, the means available in the laboratory, existing historic data, etc.
It is recommended that analytical method validation should be dissociated from validation of the sampling methods in order to reduce the risk of erroneous results. With a simultaneous validation of the two methods, if there is a bias present in the analytical method, it may be hidden by a bias in the sampling method, and vice-versa.
For example, if an analytical method gives too high a reading (due to an equipment calibration problem, for example), the recovery rates may be over-evaluated. If the method is then transferred or if the calibration is corrected, application of the overestimated recovery rate poses a risk of giving a result that seems compliant when it is not.
2. Analytical method validation
2.1 The most widely-used analysis techniques are classified by type in the table below:
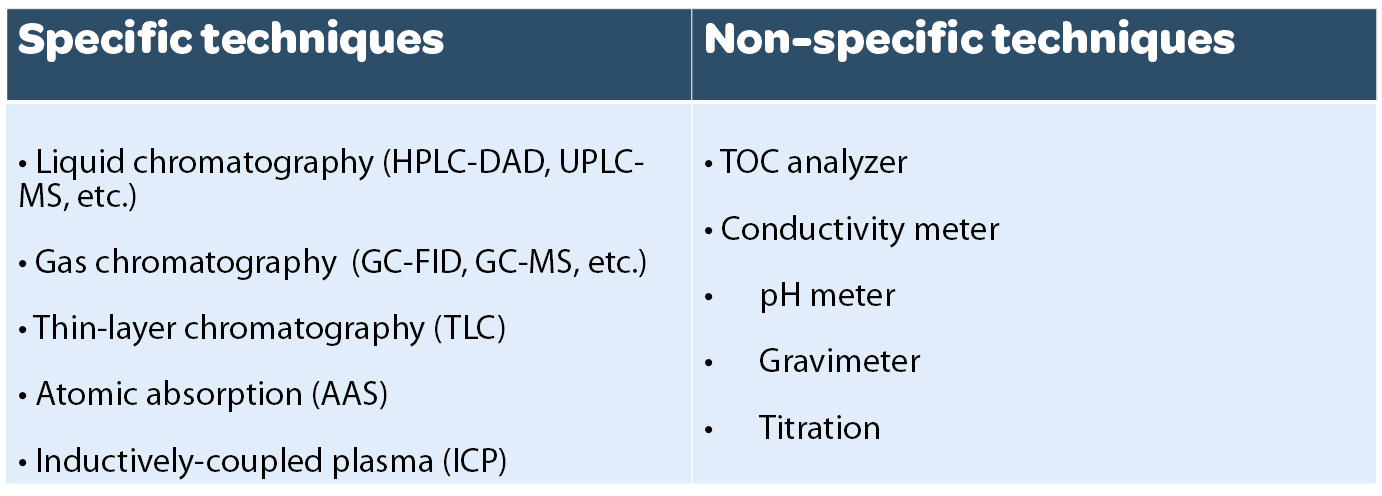
By definition, specificity is the only test that cannot be carried out for non-specific methods since it consists in checking that the signal provided by the apparatus does come from the tracer alone and is not being polluted by potential interferences.
It is carried out by individually analyzing solutions composed of potential pollution sources in order to visualize their signal and check that it is not interfering with that of the tracer.
Generally speaking, we will check the absence of interference coming from the various sampling materials:
- sampling equipment
- sampling and dilution solvents, if they are not the same
- cleaning agents (detergent, disinfectant)
- compounds other than the tracer that are present in the product.
If we do not check that there is no interference, the risk will be that of having false non-conformities when sampling on the production equipment.
In such a case, the signal that is measured and attributed entirely to the tracer may possibly be an accumulation of several other interferences, resulting in an excess reading in relation to the actual quantity of tracer.
The acceptance criterion for the test must be defined according to the acceptable level of risk. For example, it might be:
- no interference,
- a quantity of interference that is below the detection limit of the method,
- a quantity of interference that is below a percentage of the value of the cleaning validation acceptance criterion (0.5% of the criterion, for example).
2.2 Limit of quantification
The objective is to determine the quantity above which the detector visualizes the presence of the tracer and can quantify it precisely and accurately. It serves to make sure that the analysis apparatus is sufficiently sensitive to quantify the samples in the cleaning validation exercise. The limit of quantification (LOQ or LQ) absolutely must be lower than the acceptance criterion set for cleaning validation when taking account of the impact of the measurement uncertainty and recovery rates associated with the samples (see §3).
The LOQ may be estimated initially and there are several ways of doing so:
- The signal-to-noise ratio approach widely used in chromatography
The limit of quantification is generally reached when the signal-to-noise ratio is equal to or greater than 10.
- The experimental method consisting in analyzing several vials of tracer at increasing concentrations until the criteria are reached from which we consider that the response is precise and accurate
- Evaluation via the standard deviation obtained on several injections of blanks
- Evaluation via the standard deviation of the ordinate intercept of a straight line obtained by analyzing solutions with increasing concentrations
For the two techniques using standard deviations, the formula used to obtain the estimated limit of quantification is the following:
LOQ = 10 x Standard deviation
Slope
Once the limit of quantification has been estimated, it must be validated by analyzing at least 6 solutions prepared to the estimated limit of quantification, and checking that:
- The coefficient of variation (CV) on the results obtained is below a predefined threshold. This serves to assess the disparity of the results and is obtained using the following calculation method:
CV (%) = Standard deviation of the results x 100
Mean of the results
- The accuracy of each measurement value falls within a predefined interval. This is calculated as follows:
Accuracy = Measured concentration x 100
Known theoretical concentration
Everyone can then set the standards they want according to the degree of reliability they require in the results that are provided.
2.3 Linearity
This consists in checking that, over a given range of concentrations, the analysis method provides results that are directly proportional to the concentration of the tracer and that there is no detector saturation effect.
To carry out this test, a minimum of 5 solutions with different tracer concentrations must be analyzed. The different levels of concentrations can be prepared from different stock solutions in order to check the accuracy of the equation that is obtained. A linear regression line is established representing the signal that is obtained in the analysis according to the known concentration injected. The correlation coefficient (r²) of this straight line must be close to 1 for the response to be considered proportional to the quantity of tracer. An acceptability criterion of r² ≥ 0.99 is generally used. The validated range may stretch from the limit of quantification to the equivalent of 120% to 150% of the cleaning validation acceptance criterion. In all cases, the acceptance criterion for cleaning validation must fall between the value of the LOQ and the last point in the validated range (figure 1).
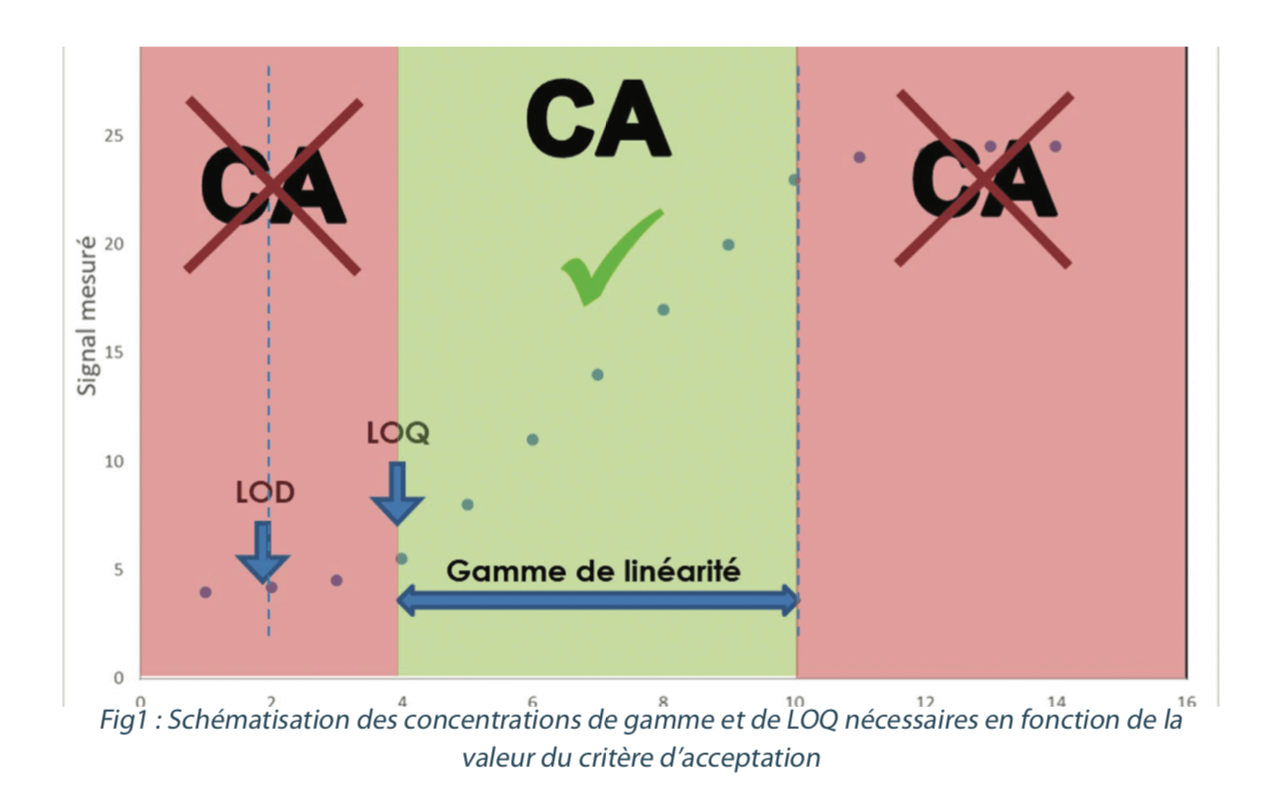
Any result obtained that is below the LOQ or above the last point in the range in cleaning validation analyses may not be included in the figures.
2.4 Precision
he aim is to check that the method always gives the same results when the same quantity of tracer is analyzed. A single solution of tracer is injected several times and a statistical analysis is performed on the results that are obtained.
This test is carried out at different levels:
- Repeatability: a series of samples is prepared and analyzed over a short period of time (same day, same operator, same equipment)
- Within-laboratory precision: two additional series that are identical to that for repeatability are analyzed with one variation being imposed for each of the series: change of operator, day or analyzer
- Reproducibility: all three parameters (operator, day, analyzer) must change, these are tests between laboratories.
L’ICH.Q2(R1) requires that precision be validated using one of the following two methodologies:
- 6 injections at a target concentration (often the acceptance criterion for cleaning validation)
- 3 injections of 3 concentrations (9 injections in total).
A low concentration level (between the limit of quantification and the cleaning validation acceptance criterion), an intermediate level (generally corresponding to the acceptance criterion), and a high level (between the acceptance criterion and the last point in the range) will be chosen in order to check the precision of the method over the whole range of concentrations.
In order to assess the precision of the method, the coefficient of variation (CV) is calculated within each series of injections (within-series CV), and for all the series (inter-series). Precision is validated if each of the CV that are obtained are below a predefined criterion (often 5% or 10% depending on the analysis method used and the requirements).
2.5 Accuracy
This test is to verify that the method produces accurate results. It is performed by analyzing solutions in triplicate at 3 different concentrations (9 solutions in all). The concentrations that are chosen may be identical to those selected for assessing precision (see § 2.4).
For each sample, a calculation is made of the percentage of accuracy, corresponding to the ratio between the measured value and the theoretical concentration value of the injected solution.
The 90% – 110% interval is widely used as an acceptability criterion for the results, but everyone can set the standards they wish according to the degree of reliability they require of the result that is provided. If the working concentration is very low, it may be necessary to extend the acceptance range of the results.
NB: Precision and accuracy are not the same. A method can be precise and inaccurate or accurate and imprecise (figure 2).

2.6 Robustness
Robustness means checking the precision and accuracy of the method even when there are slight variations on one of its parameters.
ICH.Q2(R1) explains that robustness can be considered as being induced in the development and validation of the analytical method. As validation takes place over several days or even weeks, variations will necessarily appear as the tests are being performed.
However, it is also possible to carry out an additional test by intentionally introducing a slight variation and measuring its impact.
The parameters that can be changed might be:
- Mobile-phase composition,
- Chromatography column oven temperature,
- Detection wavelength,
- Modification of the flow rate,
- A change of batch of consumables, etc.
After making the chosen variation voluntarily, a series of injections is carried out at a known concentration to check that the precision and accuracy of the series remain compliant.
3. Sampling method validation
| The purpose of sampling method validation is to determine the percentage of the tracer present initially on the equipment that will actually be collected. It also enables the stability conditions and duration to be verified (see §3.6). The percentage determined by this means is referred to as the “recovery rate” and serves to correct the analytical result to obtain the “real value” of the samples taken from the equipment, and thus the real contamination of the surface that was sampled. The overall recovery rate is based on the sampling recovery rate (the ability to recover the residue on the surface) and the extraction rate. (see Figure 3) | 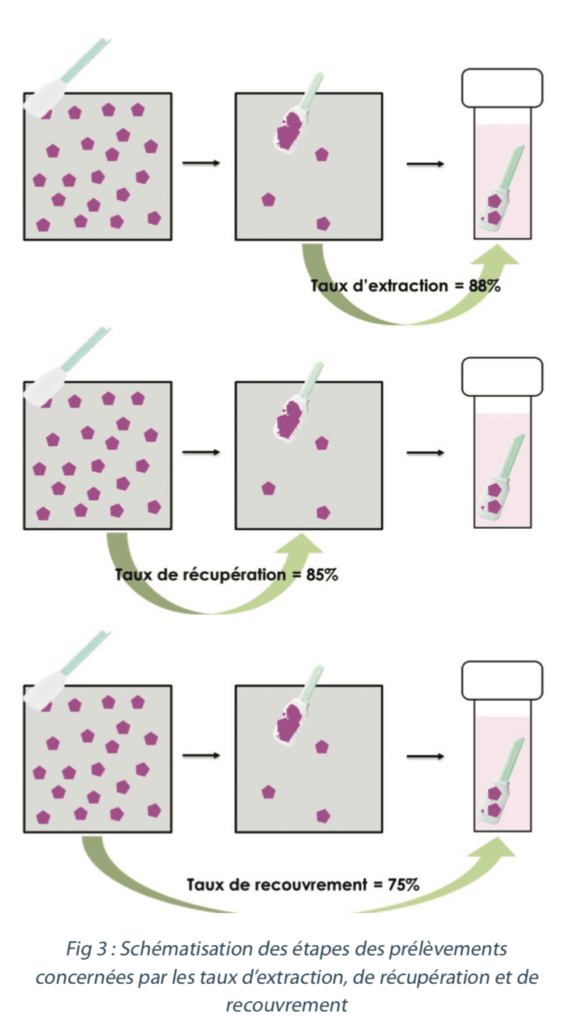 |
A sampling method is validated and a recovery rate determined for:
- A given tracer
- A defined material (stainless steel, polymers, etc.)
- A maximum sampling surface dimension
- A sampling material reference (swabs, etc.)
- A sampling methodology
- A sampling solvent
- A dilution solvent and volume
- An extraction method
If one of these parameters is changed, then the recovery rate can no longer be applied, as the efficiency of the sampling may have varied.
There are two types of sampling methods: direct and indirect sampling. Direct sampling requires the intervention of an operator and therefore an accreditation. Indirect sampling is sampling carried out by rinsing or soaking and can be automated.
3.1 Indirect sampling
The steps in indirect sampling are the following:
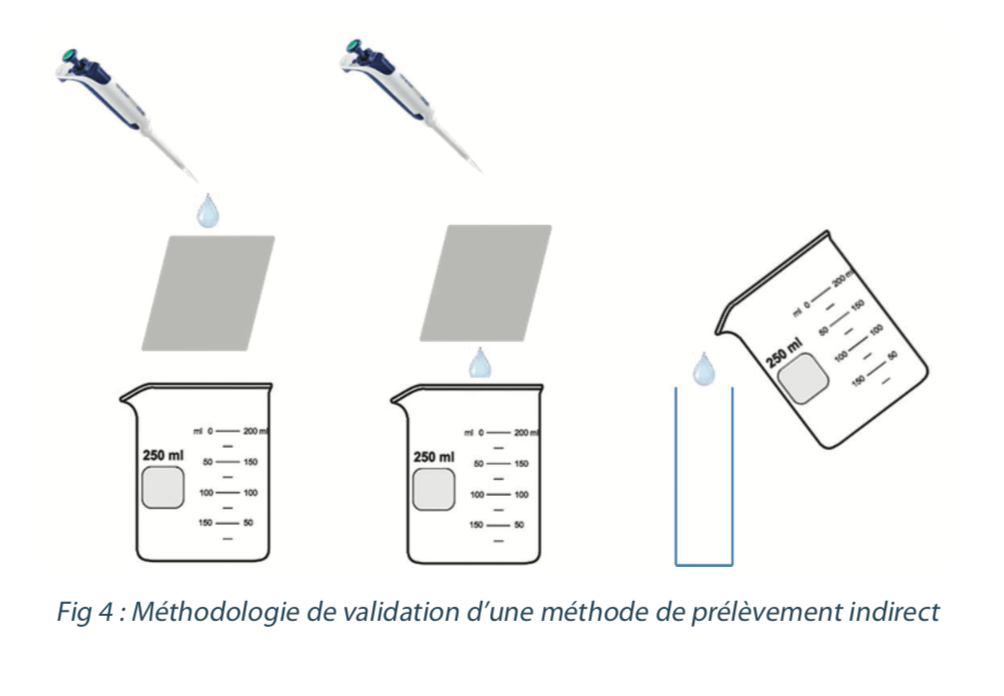
1) Add the sampling solvent
2) Collect the solvent after a pre-defined, fixed amount of time
3) Analyze the solution contained in the vial
In order to validate the recovery rates in the laboratory, the following methodology can be considered: deposit a known quantity of tracer on a coupon that is representative of the equipment. Then run over a fixed quantity of sampling solvent for recovery and then analysis (see figure 4).
3.2 Direct sampling
The steps in direct sampling are as follows:
1) Apply the defined sampling scheme using a swab
2) Insert the swab into a vial
3) Add the dilution solvent
4) Apply the extraction method
5) Analyze the solution contained in the vial
In order to validate the recovery rates in the laboratory, the following methodology can be considered: deposit a known quantity of tracer on a coupon that is representative of the equipment. Carry out the sampling in accordance with the defined methodology then analyze (see figure 5).

3.3 Extraction rate
The extraction rate can only be determined on direct samples and does not concern indirect samples.
It serves to measure the efficiency of the extraction step (step 4 of §3.2) by assessing the percentage of the tracer present on the swab after sampling that ends up in the solution thanks to the extraction method.
The methodology for determining it is as follows:
• Deposit a known quantity of tracer directly on the swab
• Perform extraction on the swab according to the defined methodology
• Analyze the solution obtained
Depositing the solution directly on the sample provides a way of mimicking swabbing that is 100% effective. In this way, only the extraction phase is evaluated.
Ideally, the extraction rate should be studied at three concentrations (a value below the acceptance criterion (CA), around the CA and above the CA) in order to ensure that the same proportion of tracer passes into the solution, whatever the quantity of tracer.
The extraction rate is not used for interpreting the results of cleaning validation. It can serve, however, to conduct optimization of the sampling method. Although it is possible to choose to study it only when the recovery rates that are being obtained are too low, it is still recommended that it should be performed beforehand in order to guarantee efficiency at each step in the sampling process.
The calculation formula is as follows:
Extraction rate = Quantity of tracer present in final solution x 100
Quantity of tracer present on swab after sampling
Extraction rates above 70% are generally deemed to be acceptable. If they are below 70%, the extraction method requires optimization (methodology, time, etc.). Once again, this criterion will depend on the level of your requirements.
3.4 Recovery rate
The recovery rate serves to measure the efficiency of the sampling method as a whole. Its aim is to quantify the percentage of tracer present on the sampled surface that will actually be found in the final solution for analysis.
It must be determined for each type of sampling according to the following methodology:
• Deposit a known quantity of tracer on a coupon that is representative of the equipment
• Perform sampling according to the defined methodology
• Analyze the samples
Ideally, the study of the recovery rate should be carried out in triplicate at 3 concentration levels: one between the LOQ and the acceptance criterion, one at the level of the acceptance criterion and one higher than the acceptance criterion, as the aim is to cover all the cases that are encountered during sampling.
For direct sampling, the test must be performed at least by two different operators in order to take account of operator variability. For indirect sampling, as the operator factor does not come into play, it is not necessary to have several operators take part.
The calculation formula is as follows:
Recovery rate = Quantity of tracer present in final solution x 100
Quantity of tracer present initially on the material
Recovery rates in excess of 70%, with a variation coefficient of 10% or less will generally be considered acceptable.
The following scale may be applied:
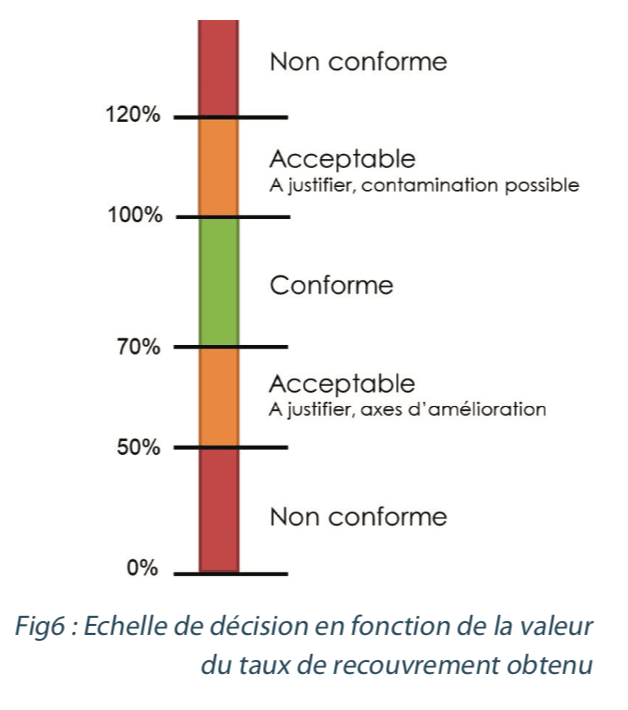
Once the recovery rate values have been generated and are compliant with the set specifications, they are used to:
- Define the value that will be used as the correction factor in the calculations to interpret the cleaning validation analyses
- Define the value that will be used as the criterion to be attained in sampling operator accreditation
In order to take account of the efficiency of the sampling method and its variability, it is preferable to perform a statistical study of the data that is collected.
The graph above (see figure 7) shows the values obtained when validating a direct sampling method. It shows all the recovery rates determined for the 18 samples taken. The red horizontal line shows the mean of those values, the gray lines represent the “mean ± 2 standard deviations” interval and the blue lines represent the “mean ± 3 standard deviations” interval.

Statistically, it is established that 95% of the values generated according to the model fall within the gray interval, and 99% within the blue interval.
The intervals generated in this way take account of the values that are obtained via the mean, and also of the disparity between the results by application of the standard deviations.
It is therefore interesting to select the lower boundary for interpreting the results of cleaning validation samples (mean – 3 standard deviations). In this way, there is a 99% chance that the real efficiency of the sampling is covered by the recovery rate that is applied. In our example, the rate chosen for correcting the results would be 68%.
For accreditations (see §3.5), the selection of the middle boundary (mean – 2 standard deviations) enables a slightly stricter criterion to be applied. The risk in applying the same recovery rate for accreditations and cleaning validation analyses is that of correcting the result by a rate that is not representative of the real efficiency of the sampling that was performed. If the operator only just manages to reach the recovery rate used as the reference in accreditation, there is no guarantee that they will manage to reproduce that efficiency in other sampling operations. By selecting a different criterion, it is possible to keep a safety margin.
3.5 Sampling training and accreditation
Once the sampling methods have been validated, it is necessary to train and accredit the operators in charge of sampling on the equipment.
The accreditation comprises a number of steps:
- Awareness of the sampling methodology instructions
- Information on the critical nature of sampling (special precautions for use of a TOC analyzer, for example)
- How to perform sampling for direct sampling
Each of the steps must be formalized and traced in order to be able to provide evidence of the training/accreditation of the different operators.
Only direct sampling requires accreditation tests to be carried out. Only this type of sampling requires human intervention, in which the gesture will have a considerable impact on sampling efficiency.
Any person who took part in validating the sampling method is automatically accredited. For others, sampling in the laboratory at an equivalent concentration to the acceptance criterion must be performed at least three times.
An operator is considered accredited when each of their samples is equal to or above the target recovery rate and if the CV calculated on their three tests is less than or equal to 10%.
When the same sampling technique is used for different tracers, it may be justified not to train and accredit the operators for each of the tracers.
Sampler accreditation monitoring is also recommended by introducing an accreditation renewal interval.
3.6 Sample stability
The purpose is to determine for how long and in what conditions a sample can be stored between sampling and laboratory analysis without observing any significant deterioration in the sample (see Figure 8).
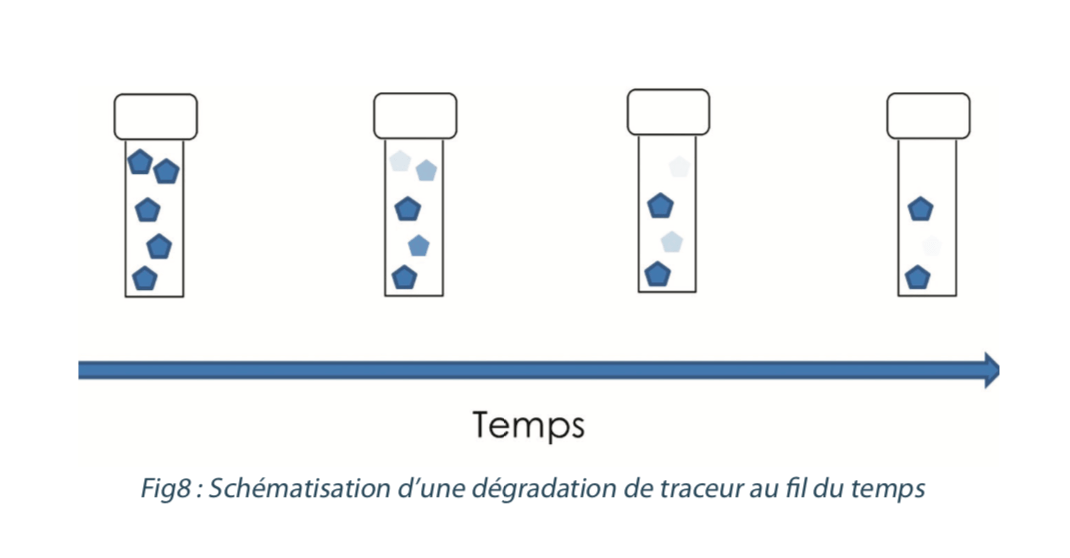
Stability validation is a way of avoiding false negatives by checking that an absence of tracer in an analysis is not simply caused by a degradation of the tracer between the moments when the sample was taken and analyzed.
This test also allows some flexibility in analysis planning. It can make it possible to analyze samples collected at different times in the same sequence, to resume an analysis sequence after a technical problem or to send samples for analysis in another laboratory.
Stability may be studied on different types of samples:
• Tracer in a solution (to mimic indirect sampling)
• Tracer deposited on a swab and placed in a solution
• Tracer deposited on a swab, stored dry and then placed in solution just before analysis.
The conditions that are tested must be those the samples will encounter. For example, account must be taken of sample transportation conditions (duration, temperature, etc.). For temperature, it may prove simpler to validate stability with cold storage, as cold temperatures are easier to control during transport than ambient temperatures (which vary according to transport conditions).
To carry out this test, samples of tracer are prepared at a known concentration (generally close to the acceptance criterion) and stored in the defined conditions (corresponding to routine conditions).
The samples prepared in this way are then analyzed on D0 (initial day of the study) to obtain the results that will serves as the baseline for assessing stability. Then, the samples which were all prepared on D0 will be injected at a defined frequency to assess any potential variation in concentration.
In order to assess sample stability, the results obtained in each series of injections will be compared to those obtained at D0 using the following formula:
Stability = Result obtained on Dx x 100
Result obtained on D0
The criteria for assessing stability may be the same as those for the accuracy test, for example. The determination of those values depends on the tolerance you want to allow on the results.
Conclusion
Validation of the analytical method checks that the method in question does measure the target tracer in an accurate and repeatable manner within the range of concentrations studied. If this step is omitted, the results that are obtained may be challenged.
Validation of the sampling methods enables us to determine the proportion of the tracer present on the equipment that is recovered by sampling operations. This percentage then allows the real quantity of tracer that was on the sampled surface to be determined.
These validations are prerequisites for all analyses to be performed in cleaning process validation to guarantee the reliability of the results and thus control risks of contamination.
Share article


Eva BELLANGER – Cophaclean
eva.bellanger@cophaclean.fr

Laurent SIMON – Cophaclean
laurent.simon@cophaclean.fr
Glossary
AC: Acceptance Criterion
TOC: Total Organic Carbon
CV : Coefficient of Variation
LOQ / LQ: Limit of Quantification
References
1. ICH.Q2(R1) Validation of Analytical Procedures: Text and Methodology
2. GMP Annex 15 Qualification and Validation
3. PDA Technical Report n°29 and 49
